The FORS-D-related data from Table 1 show that the
negative slopes correlate best with the data points (highest value of r),
and achieve their greatest and most significant displacement from
zero (P<0.001 that they not significantly different from
zero), when total substitutions relative to HIVHXB2 are around 450.
This number of substitutions is characteristic of members which are still within group B. Members of
group B which differ by less than around
100 substitutions from HIVHBX2, have low slopes, high P
values (indicating low significance), and low correlation coefficients (indicating poor
correlations). Above 450 substitutions,
slopes and correlation coefficients tend to decline, and P values
tend to increase, but usually remain <0.05 (indicating significance). |
Table 2. Linear Regression
Relationships between Base Indel Density and FORS-D, FONS and FORS-M
| Subtype |
Genbank
name |
Indels |
FORS-D |
FONS |
FORS-M |
| Slope |
P |
r |
Slope |
P |
r |
Slope |
P |
r |
| B .
. |
HIVBH102 |
40 |
0.243 |
<0.001 |
0.267 |
-0.230 |
0.124 |
0.116 |
0.013 |
0.914 |
0.008 |
| HIVPV22 |
44 |
0.240 |
0.001 |
0.240 |
-0.255 |
0.135 |
0.108 |
-0.014 |
0.915 |
0.008 |
| HIVSF2CG |
119 |
-0.059 |
0.402 |
0.061 |
0.230 |
0.163 |
0.101 |
0.171 |
0.189 |
0.096 |
| HIVMNCG |
112 |
-0.040 |
0.601 |
0.037 |
0.207 |
0.256 |
0.083 |
0.167 |
0.244 |
0.085 |
| HIVJRCSF |
106 |
0.032 |
0.617 |
0.037 |
-0.016 |
0.915 |
0.008 |
0.016 |
0.890 |
0.010 |
| D . |
HIVZ2Z6 |
103 |
-0.114 |
0.105 |
0.122 |
0.329 |
0.038 |
0.156 |
0.215 |
0.082 |
0.131 |
| HIVNDK |
110 |
-0.131 |
0.036 |
0.157 |
0.358 |
0.009 |
0.154 |
0.228 |
0.034 |
0.158 |
| HIVELI |
90 |
-0.211 |
0.034 |
0.178 |
0.549 |
0.005 |
0.207 |
0.338 |
0.027 |
0.165 |
| A |
HIVU55A |
197 |
-0.127 |
0.016 |
0.180 |
0.098 |
0.408 |
0.062 |
-0.029 |
0.748 |
0.024 |
O
. |
HIVANT70C |
583 |
0.007 |
0.744 |
0.021 |
-0.303 |
<0.001 |
0.396 |
-0.297 |
<0.001 |
0.482 |
| HIVMNP5180 |
512 |
0.051 |
0.074 |
0.130 |
-0.361 |
<0.001 |
0.394 |
-0.310 |
<0.001 |
0.430 |
|
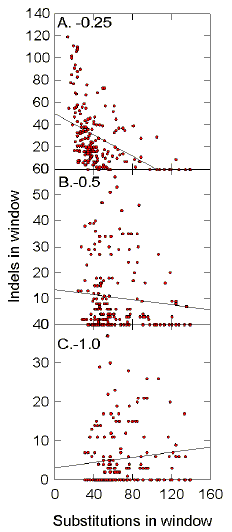
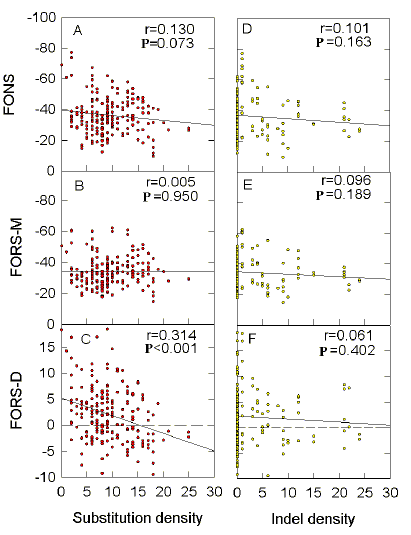
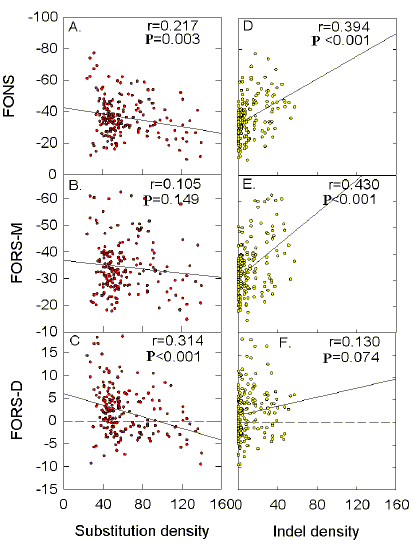
The linear regression parameters of
plots, similar to those shown in Figs. 9 and 10, are summarized here for other HIV-1
isolates. Indels are relative to the prototyp HIVHXB2.
|
|
Table 2 summarizes similar data for
indels. The most
significant correlation with FORS-D values occurs in the case of genomes which diverge
least from the prototype, and this correlation is positive. The strong positive
correlation with FORS-M values seen in the case of HIVMVP5180 (Fig. 10e) also applies to
another strongly diverging genome (HIVANT70C). Thus
indels
correlate best with a base order-dependent function when at low density and with a base
composition-dependent function when at high density.
It can be seen from Tables 1 and 2 that, following
from the fact that for each sequence window the FORS-D value is the difference between the
FORS-M and the FONS values, the corresponding slope values show the same relationship.
|
No Relationship between FORS-D Value and (G+C)%
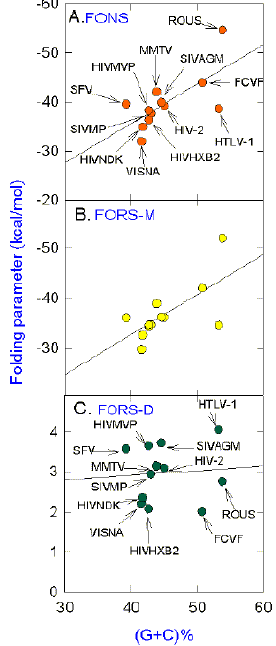
Fig. 11. Linear regression analysis of average values for (A)
FONS, (B) FORS-M and (C)
FORS-D for various
retroviruses, as a function of their base composition, (G+C)%. For each retrovirus plots
were prepared similar to those shown in Figures 1-3. Average values were determined for
all the 200 nt overlapping windows. G+C percentages were determined from the GenBank
entries. Probabilities (P) that the slopes are not significantly
different from zero are A, 0.014, B, 0.016, and C,
0.812. Correlation coefficients (r) are A,
0.68, B, 0.68, and C,
0.08. Names of viruses are abbreviated in A
and C. The arrangement of points in B is similar to that in A.
The full names and GenBank designations of the viral isolates referred to are: SFV (simian
foamy virus; SFVGENOME), VISNA (visna virus; VLVCGA), HIVNDK (human immunodeficiency virus
type 1; HIVNDK), HIVHXB2 (human immunodeficiency virus type 1; HIVHXB2CG), HIVMVP (human
immunodeficiency virus type 1; HIVMVP5180), SIVMP (simian Mason-Pfizer virus;
SIVMPCG),
MMTV (murine mammary tumour virus; MMTPROCG), SIVAGM (simian immunodeficiency virus;
SIVAGM155), HIV-2 (human immuno- deficiency virus type 2; HIV2ISY), FCVF (feline leukaemia
virus; FCVF6A), HTLV-1 (human T cell leukaemia virus type 1; HTVPRCAR), and ROUS
(Rous
sarcoma virus; ALRCR). |
The (G+C)% of the HIV-1 genomes shown in Table 1
have similar values, so that one cannot assess the effect of changes in this parameter on
base composition- dependent components of the stem-loop potential. Some retroviruses have
quite different G+C percentages and, as might be expected from the greater interaction
energy of GC base pairs relative to AT base pairs, average FONS and FORS-M values tend to
increase with increasing (G+C)% (Figs.
11a,b). However, the relationship is not uniform
(correlation coefficients of 0.68). For example, the G-rich Rous sarcoma virus and the
very C-rich human T cell leukaemia virus (HTLV-1), although having approximately the same
(G+C)%, differ considerably from each other in values for FONS (Fig.
11a) and
FORS-M (Fig. 11b). The great excess of C over G in HTLV-1 means that G might limit the number of GC
bonds that could form; thus FONS and FORS-M values would be less than expected based on
total G+C content.
Also, as might be expected, no significant
relationship is evident between base composition (G+C percentage) and FORS-D values. By
subtracting the FONS value (a function both of base order and of base composition) from
the FORS-M value (a function of base composition), to arrive at the FORS-D value, the
contribution of base composition to stem-loop potential is removed. All FORS-D values are
positive, although most values are below the values determined for some long human genomic
segments which are largely composed of intergenic DNA (approx.
4
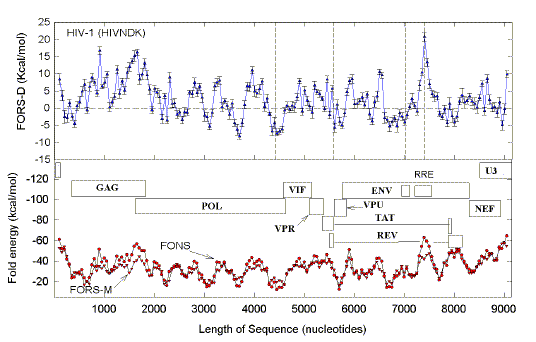
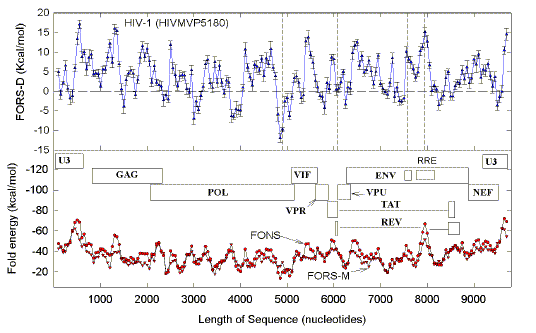
kcal/mol; Forsdyke, 1995b). Whereas points for the three HIV-1 subtypes shown (HIVHXB2,
HIVNDK and HIVMVP), are close together in Figures 11a and 11b, the points are more widely
dispersed among the points for other retroviral types in Figure 11c. HTLV-1 has the
highest FORS-D value. Thus, inspite of the imbalance in relative levels of G and C, the
primary sequence of the C-rich HTLV-1 has adapted to generate FORS-D values of the same
order as long genomic sequences of its host.
FORS-D plots for the retroviruses mentioned in Figure 11,
differ in numerous respects from those shown for the HIV subtypes (Figs
1-3). This will be
the subject of a future communication, which will also contain a more detailed
consideration of the relationship between FORS-D values and sequence features (e.g.
proportions of synonymous and non-synonymous mutations; Scpaer and Mullins, 1993).
|
Discussion
Codons and Stem-Loops are Local "Strategies"
Base composition may be expressed
in a variety of ways. (G+C)% is particularly informative, being a dominant characteristic
of a genome or large genome segment (Bernardi,
1989). Thus codons adapt to the (G+C)% of
the segment inwhich they are located (Grantham et al.
1980). This indicates that (G+C)% is
a genomic "strategy",
not a local "strategy". Codons are a local "strategy".
For this reason, the contribution of base composition to the local stability of stem-loops
is seen as an externally imposed (non-local) characteristic (see Methods).
To a small extent, base order is also a genomic
"strategy". Thus the low frequency of the
dinucleotide TpA seems to be universal. The dinucleotide CpG is in low frequency in many
taxa, but in high frequency in most bacteria (Nussinov, 1994; Forsdyke,
1995d). However,
base-order is predominantly a local "strategy",
influencing both codons and stem-loop stability. It has been shown (see Methods) that base
order-determined stem-loop potential closely corresponds to the "statistically significant" stem-loop potential of Le and
Maisel (1989). In the present work, their approach to quantitating the latter as the
"segment score", was adapted as "FORS-D analysis". |
FORS-D Values are Small but Highly Informative
|
It may seem unlikely that FORS-D values, which are
so small relative to the FONS and FORS-M values from which they are derived, could be
informative about underlying evolutionary processes affecting nucleic acids. However, the
values do not fluctuate randomly about zero; positive values are found consistently, and
are widely distributed in long genomic segments from a variety of species (Forsdyke,
1995b-d, 1996). For example, the average value for 69 windows at 1 kb intervals in a 68 kb
segment from human chromosome 19 (HUMMMDBC) is 4.4+0.9_kcal/mol. This reveals the
existence of a genome-wide evolutionary pressure ("fold
pressure") favouring positive FORS-D values. Negative values have been
interpreted as revealing some local functional constraint on base order (such as the
encoding of a protein), which prevents a region achieving the most stable stem-loop
conformation of which it is capable. Indeed, negative values are found in promoter
regions, and tend to occur more frequently in exons than in introns. The present work
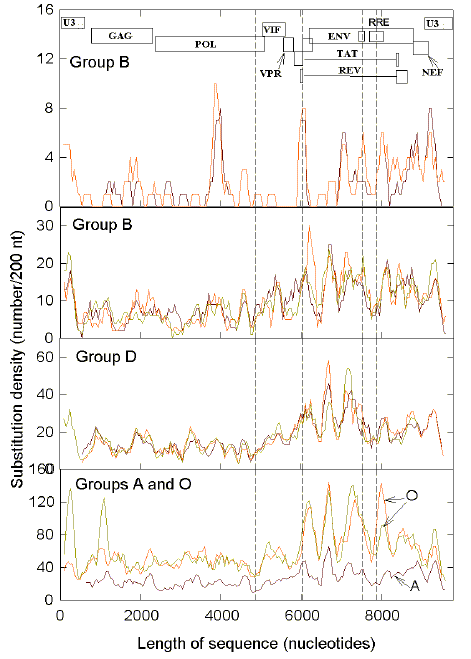
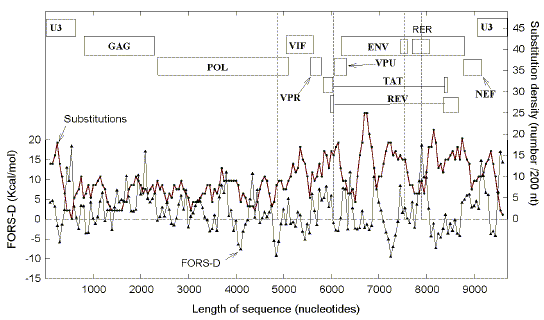
shows that the density of substitution mutations in HIV-1 is reciprocally related to
FORS-D values (reflecting base order-determined stem-loop potential), but not to FORS-M
values (reflecting base composition-determined stem-loop potential; Figs. 9, 10; Table 1).
This confirms the observations of Le et al. (1988, 1989,
1990), and emphasises the power
of an analytical approach which relies on differences of a few kcal/mol.
Le et al (1991) state that "The significance score [e.g. FORS-D value] characterizes the specific
arrangement of the nucleotides in the segment that could imply a structural role for the
sequence information". This is the nearest the authors get to discriminating
between the contributions of base order and base composition which is an important aspect
of the present work. Also in the present work base substitutions and indels are considered
separately. Le et al. (1989) assess base substitutions and indels collectively as "sequence variability". The failure of indels to contribute to
the reciprocal relationship between FORS-D and sequence variability (Figs. 9,10; Table
2)
may not have been critical to their results; in HIV-1 substitutions exceed indels by a
factor of between 2 (HIVBH102) and 9 (HIVELI), when using a gap penalty of -0.5.
|
Paradox Explained by Positive Darwinian Selection?
The observation that negative FORS-D values (implying functional
importance) are correlated with sequence variability
(substitutions) appears paradoxical in that functional importance is usually correlated
with sequence conservation in the
case of species in which evolutionary changes occur on a geological time scale.
Individuals with mutations in functionally important regions are usually negatively
selected. An important clue leading to an apparent resolution of the paradox is provided
by studies of the distribution of FORS-D values in genes, which, like retroviruses (Scpaer
and Mullins, 1993), are under positive "Darwinian"
selection.
Snake venom protein genes appear to be engaged in an
"arms race" with the genes of their prey which
confer resistance. Snake venom phospholipase A2 genes have very high substitution rates in exons and very low substitution rates in introns. As in
the case of the RNA genomes considered here, there is a reciprocal relationship between
base order-dependent stem-loop potential and substitution density (Forsdyke,
1995c).
Similarly, the reciprocal relationship holds for the polymorphic regions of MHC genes
which bind peptide fragments from pathogens for recognition by the host immune system
(D.
R. Forsdyke, unpublished work). These regions are also under positive Darwinian selection
(Hughes et al. 1994), probably in response to coevolving parasites
(Klein and O'Huigin, 1994). Thus, it is possible that the reciprocal relationship holds for other genomes or
genome segments which are rapidly evolving in this way. This implies that it may be easier
to adapt the sequence of a conserved region for encoding both specific function and
stem-loop potential (by synonymous substitutions and conservative amino acid exchanges),
than to adapt the sequence of a region rapidly accepting mutations under positive
selection pressure.
Thus, the proposed resolution of the
paradox requires consideration of the particularly high rates of accepted mutations in RNA
genomes, which result, not in species with members of relatively uniform sequence, but in
"quasispecies" with members of varying sequence
(Holland et al. 1992). Within one HIV-1-infected individual, the sequence of the
predominant viral population varies with the stage of the disease. This is of adaptive
value to the virus which appears more able to escape the cellular and humoral immune
defences of its host. However, at some level, the adaptive value of a high mutation rate
should be limited by the maladaptive effect of loss of information required for normal
function.
An important way this loss of information could be
countered in the case of genomes -- which, at some stage in the life history of the
organism, might share a common intracellular environment, -- would be by recombination
 (Bernstein and Bernstein, 1991). Retroviruses transmit two
copies of their genomes to the cells they infect, and have high rates of recombination
(Coffin, 1992). Thus, if segments of the primary sequence
are functionally important for recombination (i.e. have stem-loops), keeping operational
these segments might be as important as keeping operational protein-encoding segments and
segments concerned with regulation. The latter two groups of segments,
when in regions under positive selection pressure (Scpaer and Mullins,
1993), may be
associated with negative FORS-D values since the sequences may not have been able to
optimize simultaneously both their function-encoding abilities and their folding
propensities. As these segments become less important for successful recombination (loss
of base order-dependent stem-loop potential), they are able to accept more substitutions
than segments better adapted for recombination (associated with high FORS-D values). The
proposed relationship between the conflicting evolutionary forces acting on the HIV-1
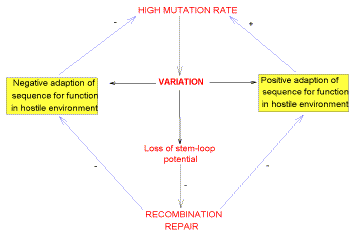
genome is summarized in Figure 12.
 |
|
|
Fig. 12. Summary of the proposed evolutionary factors which result
in a negative correlation between fold pressure as measured by FORS-D values, and
substitution density. A high mutation rate results in sequence variation (substitutions),
which has three functional consequences. Positive "Darwinian" adaptions (e.g.
changes in a sequence encoding a protein recognized by the host immune system) are
favourable, and create a selection pressure for further increasing the mutation rate (e.g.
decreasing the fidelity of reverse transriptase).
Negative adaptions (e.g. impairment of a
vital function) are detrimental, and create a selection pressure for lowering the mutation
rate (e.g. increasing the fidelity of reverse transcriptase). These negative adaptations
may be countered by repair or correction through recombination, which itself may be
impaired by sequence variations which decrease base order-determined stem-loop potential
(since stem-loops are important for recombination).
Of the three consequences of
variation, the decrease of stem-loop potential is likely to be of particular importance,
since it impairs the ability to correct other mutations by recombination. Thus, mutations
which decrease this potential (and hence the recombination function) are as likely to be
selected against as are negatively adaptive mutations which decrease conventional
functions (e.g. the encoding of a specific protein or the regulation of its expression).
On the other hand, recombination must not be so efficient that it repairs or corrects
mutations which are positively adaptive.
|
Accelerated
Speciation Model
In the words of Holland and
coworkers (1982), "DNA chromosomes of eukaryotic host organisms
generally require geologic time spans to evolve to a degree that their RNA viruses can
achieve in a single human generation". Members of a particular HIV-1 subtype
might be able to recombine successfully with each other if coinfection occurred
(Robertson
et al. 1995). However, because of variations in the distribution of base order-determined
stem-loop potential (Figs. 1-3), intersubtype recombination might be more difficult.
The
changes in the various linear regression parameters associated with FORS-D values plotted
as a function of substitution density (Table 1), may reflect this. When substitutions are less than 100/genome,
the slope of the plot of FORS-D versus substitutions is low, and not significantly
different from zero. At this low substitution density high FORS-D regions are spared no
more than other regions, implying that at this density recombination tends not to be
impaired. In this respect the two genomes are behaving like
alleles which usually do not change in heterozygotes undergoing recombination.
When substitutions are around
460/genome, the slope is maximum (Fig. 9;
Table 1). At this substitution density, organisms are still subtype B
(the same as the prototype), and high FORS-D regions are spared; this implies that this
density impairs the organism's recombination function, so that genomes with mutations in
potential stem-loop regions are selected against.
At substitution densities above 460/genome,
the slope decreases, implying that high FORS-D regions are being spared less. These high
substitution densities can be regarded as approaching an "escape"
value beyond which recombination with the prototype (to correct sequence errors) is less
likely to be beneficial, and thus less evolutionarily advantageous. Under this condition,
the value of matching the FORS-D profile of a genome (Figs. 2, 3) with that of the
prototype genome (Fig. 1), in order to optimize recombination, decreases; thus, the ratio
of prototype FORS-D values to substitution density (slope), declines (Table 1).
In this circumstance, there would be less selective
advantage in retaining the similarities in (G+C)% which, at present, are very close (Table
1). The ability to resist intrinsic mutational biases affecting overall base composition
(Filipski, 1990; Vartanian et al. 1991), would be decreased. Thus,
it would be easier for G+C percentages to diverge. As a consequence of this, recombination
with the prototype would be even more difficult. Thus, the generation of distinct
retroviral species (speciation) would have begun.
In this respect
retroviral genomes seem to offer a tractable model system for addressing general aspects
of the speciation problem. Mechanisms by which percentage G+C differences might affect
stem-loops and inhibit recombination are discussed elsewhere (Forsdyke,
1996). The
importance of (G+C)% compatibility for recombination is emphasized by the observation that
the high (G+C)% HTLV-1 genome is excluded from low (G+C)% sectors of the host genome
(Zoubak et al. 1994). |
Importance of (G+C)% Differences in Speciation
Although a subject of some controversy,
species can simply be defined as consisting of organisms which are successful at
reproducing sexually with each other. Sexual species are reproductively isolated from
other sexual species. Sueoka in 1961 noted that freely
crossing (i.e. recombining) strains of tetrahymena have similar G+C percentages.
The importance of (G+C)% to speciation has recently been emphasized by comparisons of the
retroviral phylogenetic trees generated from natural and randomised sequences
(Bronson and
Anderson 1994). A natural sequence is but one member of a large set of possible sequences
with the same base composition. The average
characteristic of this set can be arrived at by randomizing the natural sequence (see
Methods). If the phylogenetic tree which can be generated
from natural sequences closely resembles the average
tree which can be generated from their randomized
equivalents (as was found by Bronson and Anderson who randomized and
aligned pairs of sequences a thousand times), it follows
that speciation is more likely to be a function of base composition than of base order.
That base composition is a major force driving the
evolution of retroviruses is apparent from the major influence of base composition on
codon choice, which extends to non-synonymous codons and greatly biases amino acid
composition (Berkout and Hemert, 1994; Bronson and Anderson,
1994). The latter authors
note that viruses with radically different base frequencies
have the potential to coinfect cells, and postulate that the different
base frequencies would dictate different precursor requirements (nucleotides, amino
acids), so that the viruses would occupy different "ecological
niches" within the host cell. This avoidance of competition with other viruses
for common nutrients would have driven the differentiation in base composition (i.e. the
viruses would have resisted intrinsic mutational biases to a lesser extent).
However, while there is some evidence for
intracellular compartmentation at the nucleotide level (Leeds et al.
1985), there is none
for compartmentation at the amino acid level. A more attractive explanation, which has
guided the present work, is advanced elsewhere (Forsdyke, 1995b,
1996). The key postulates
are that:
(i) recombination between genomes facilitates the repair or
correction of mutations;
(ii) accurate repair requires an accurate template, which must not
have diverged much from the sequence which is being repaired; thus intra-species
recombination is favoured and inter-species
recombination is disfavoured (i.e. organisms which recombine with other species are
negatively selected);
(iii) for both DNA and RNA genomes, differences in base-composition
inhibit recombination based on the "kissing"
between the loops of stem-loop structures,
(iv) a key stage in speciation is arrived at when there is a critical
degree of sequence divergence from the prototype such that it is more important not to recombine, than to recombine, with
members of the prototype species. Thus, it is the need to occupy different "recombinational niches" (i.e.
to occupy particular species niches), rather than "ecological niches", that drives differentiation of base
composition and speciation.
|
Acknowledgements.
I thank J. Gerlach for assistance with computer configurations, J. Mau (National Research
Council) and the Queen's University Statlab for advice, L. Russell for technical help, and
the Medical Research Council of Canada for support.
References
Berkhout B, Hemert, F. J. van (1994) The unusual nucleotide
content of the HIV RNA genome results in a biased amino acid composition of HIV proteins. Nucleic Acids Res 22:1705-1711
Bernardi G (1989) The isochore organization of the human genome.
Annu Rev Genet 23:637-661
Bernstein C, Bernstein H (1991) Aging,
Sex and DNA Repair. Academic Press, San Diego
Blum S, Forsdyke RE, Forsdyke DR (1990) Three human homologs of
a murine gene encoding an inhibitor of stem cell proliferation. DNA
Cell Biol 9:589-602
Braun MJ, Clements JE, Gonda MA (1987) The visna virus genome:
evidence for a hypervariable site in the env gene and sequence homology among
lentivirus envelope proteins. J Virol
61:4046-4054
Bronson EC, Anderson JN
(1994) Nucleotide composition as a driving force in the evolution of
retroviruses. J Mol Evol 38:506-532
Crick F (1971) General model for the chromosomes of higher
organisms. Nature 234:25-27
Coffin JM (1992) Genetic diversity and evolution of
retroviruses. Curr Topics Microbiol Immunol
176:143-163
Cullen BR (1991) Regulation of HIV-1 gene expression. FASEB J. 5:2361-2368
Currey KM, Peterlin BM, Maizel JV (1986) Secondary structure
prediction of poliovirus RNA: correlation of computer-predicted with electron
microscopically observed structure. Virology
148:33-46
Doolittle RF, Feng D-F, Johnson MS, McClure MA (1989) Origins
and evolutionary relationships of retroviruses. Quart
Rev Biol 64:1-30
Doyle GG (1978) A general theory of chromosome pairing based on
the palindromic DNA model of Sobell with modifications and amplification. J Theor Biol 70:171-184
Filipski J (1990) Evolution of DNA sequence. Contributions of
mutational bias and selection to the origin of chromosomal compartments. Adv Mutagenesis Res 2:1-54
Fitch WM (1983) Random sequences. J
Mol Biol 163:171-176
Forsdyke DR (1995a). Fine-tuning of intracellular protein
concentrations, a collective protein function involved in aneuploid lethality,
sex-determination and speciation? J Theor Biol
172:335-345
Forsdyke DR (1995b) A stem-loop "kissing" model for
the initiation of recombination and the origin of introns. Mol
Biol Evol 12:949-958
Forsdyke DR (1995c) Conservation of stem-loop potential in
introns of snake venom phospholipase A2 genes. An application of FORS-D
analysis. Mol Biol Evol 12:1157-1165
Forsdyke DR (1995d) Relative roles of primary sequence and
(G+C)% in determining the hierarchy of frequencies of complementary trinucleotide pairs in
DNAs of different species. J Mol Evol
41: 573-581.
Forsdyke DR (1996) Different biological species
"broadcast" their DNAs at different (G+C)% "wavelengths". J Theor Biol 178:405-417.
Freter RR, Irminger JC, Porter JA, Jones SD, Stiles CD (1992) A
novel 7-nucleotide motif located in 3' untranslated sequences of the immediate-early gene
set mediates platelet-derived growth factor induction of the JE gene. Mol Cell Biol 12:5288-5300
Grantham R, Gautier G, Gouy M,
Mercier R, Pare A (1980) Codon catalog usage and the genome hypothesis. Nucleic Acids Res. 8:r49-r62
Gribskov M, Devereux J (1991) Sequence
Analysis Primer. Stockton Press, New York.
Gurtler LG, Hauser PH, Eberle J, Brunn A von, Knapp S, Zekeng L,
Tsague JM, Kaptue L (1994) A new type of human immunodeficiency virus type 1 from
Cameroon. J Virol 68:1581-1585
Hawley RS, Arbel T (1993) Yeast genetics and the fall of the
classical view of meiosis. Cell 72:301-303
Holland J, Spindler K, Horodyski F, Grabau E, Nichol S, VandePol
S (1982) Rapid evolution of RNA genomes. Science
215:1577-1585
Holland JJ, Torre JC de la, Steinhauer DA (1992) RNA virus
populations as quasispecies. Curr Topics Microbiol
Immunol 176:1-20
Huet T, Cheynier R, Meyerhans AR, Roelants G, Wain-Hobson S
(1990) Genetic organization of a chimpanzee lentivirus related to HIV-1. Nature 345:356-358
Hughes AL, Hughes MK, Howell CY, Nei M (1994) Natural selection
at the class II major histocompatibility complex loci of mammals. Phil
Trans R Soc Lond B 345:359-367
Karlin S, Brendel V (1992) Chance and statistical significance
in protein and DNA sequence analysis. Science
257:39-49
Kleckner N, Padmore R, Bishop DK (1991) Meiotic chromosome
metabolism: one view. Cold Spring Harbor Symp Quant Biol
56:729-743
Kleckner N, Weiner BM (1993) Potential advantages of unstable
interactions for pairing of chromosomes in meiotic, somatic and premeiotic cells. Cold Spring Harbor Symp Quant Biol 58:553-565
Klein S (1994) Choose your partner: chromosome pairing in yeast
meiosis. Bioessays 16:869-
871
Klein J, O'Huigin C (1994) MHC polymorphism and parasites. Phil Trans R Soc Lond B 346:351-358
Lasky LA, Nakamura G, Smith DH, Fennie C, Shimasaki C, Patzer E,
Berman P, Gregory T, Capon DJ (1987) Delineation of a region of the human immunodeficiency
virus type 1 gp120 glycoprotein critical for interaction with the CD4 receptor. Cell 50:975-985
Le S-Y, Chen J-H, Braun MJ, Gonda MA, Maizel JV (1988) Stability
of RNA stem-loop structure and distribution of non-random structure in the human
immunodeficiency virus (HIV-I). Nucleic Acids Res
16:5153-5168
Le S-Y, Chen J-H, Chatterjee D, Maizel JV (1989). Sequence
divergence and open regions of RNA secondary structures in the envelope regions of 17
human immunodefiency virus isolates. Nucleic Acids Res
17:3275-3288
Le S-Y, Chen J-H, Maizel JV
(1989) Thermodynamic stability and statistical significance of potential stem-loop
structures situated at the frameshift sites of retroviruses. Nucleic
Acids Res. 17:6143-6152
Le S-Y, Chen J-H, Maizel JV (1991) Detection of unusual RNA
folding regions in HIV and SIV sequences. CABIOS
7:51-55
Le S-Y, Maizel JV (1989) A method for assessing the statistical
significance of RNA folding. J Theor Biol
138:495-510
Le S-Y, Malim MH, Cullen BR, Maizel JV (1990). A highly
conserved RNA folding region coincident with the Rev response element of primate
immunodeficiency viruses. Nucleic Acids Res
18:1613-1623
Leeds JM, Slabourgh MB, Mathews CK (1985) DNA precursor pools
and ribonucleotide reductase activity: distribution between the nucleus and cytoplasm of
mammalian cells. Mol Cell Biol 5:3443-3450
Mann DA, Mikaelian I, Zemmel RW, Green SM, Lowe AD, Kimura T,
Singh M, Butler JG, Gait MJ, Karn J (1994) A molecular rheostat. Cooperative Rev binding
to stem I of the Rev-response element modulates human immunodeficiency virus type-1 late
gene expression. J Mol Biol 241:193-207
Martinez HM (1988) A flexible multiple sequence alignment
program. Nucleic Acids Res 16:1683-1691
Min Jou W, Fiers W (1976) Studies on the bacteriophage MS2.
XXXIII. Comparison of the nucleotide sequences in related bacteriophage RNAs. J Mol Biol 106:1047-1060
Murchie AIH, Bowater R, Aboul-Ela F, Lilley DMJ (1992) Helix
opening transitions in supercoiled DNA. Biochem Biophys
Acta 1131:1-15
Myers G, Korber B, Wain-Hobson S, Smith RF, Pavlakis GN (1993)
Human Retroviruses and AIDS 1993. A Compilation and
Analysis of Nucleic Acid and Amino Acid Sequences. Los Alamos
National Laboratory, New Mexico
Nussinov R (1984) Strong doublet preferences in nucleotide
sequences and DNA geometry. J Mol Evol
20:111-119
Orita M, Iwahana H, Kanazawa H, Hayashi K, Sekiya T (1989)
Detection of polymorphisms of human DNA by gel electrophoresis as single strand
conformation polymorphisms. Proc Natl Acad Sci USA
86:2766-2770
Radman M, Wagner R, Kricker MC (1993) Homologous DNA
interactions in the evolution of gene and chromosome structure. Genome
Anal. 7, 139-154.
Ratner L, Haseltine W, Patarca R, Livak KJ, Starcich B, Josephs
SF, Doran ER, Rafalski JA, Whitehorn EA, Baumeister K, Ivanoff L, Petteway SR, Pearson ML,
Lautenberger JA, Papas TS, Ghrayeb J, Chang NT, Gallo RC, Wong-Staal F (1985) Complete
nucleotide sequence of the AIDS virus, HTLV-III. Nature 313:277-284
Ratner L, Fisher A, Jagodzinski LL, Mitsuya H, Liou R-S, Gallo
RC, Wong-Staal F (1987). Complete nucleotide sequences of functional clones of the AIDS
virus. AIDS Res Hum Retrovir 3:57-69
Robertson DL, Sharp PM, McCutchan FE, Hahn BH (1995).
Recombination in HIV-1. Nature 374:124-126
Romanova LI, Blinov VM, Tolskaya EA, Viktorova EG, Kolesnikova
MS, Guseva EA, Agol VI (1986) The primary structure of crossover regions of intertypic
poliovirus recombinants: a model of recombination between RNA genomes. Virology 155:202-213
Ryan BF, Joiner BL (1994) Minitab
Handbook. 3rd edition. Wadsworth Publishing, Belmont, California.
Salser W (1977) Globin mRNA sequences: analysis of base pairing
and evolutionary implications. Cold Spring Harb Symp
Quant Biol 42:985-1002
Scpaer EG, Mullins JI (1993) Rates of amino acid change in the
envelope protein correlates with pathogenicity of primate lentiviruses. J Mol Evol 37:57-65
Sobell HM (1972). Molecular mechanism for genetic recombination.
Proc Natl Acad Sci USA 69:2483-2487
Spire B, Sire J, Zachar V, Rey F, Barre-Sinoussi B, Galibert F,
Hampe A, Chermann J- (1989). Nucleotide sequence of HIV1-NDK: a highly pathogenic strain
of the human immunodeficiency virus. Gene
81:275-284
Sueoka N (1961)
Compositional correlation between deoxyribonucleic acid and protein.
Cold Spring Harbor Symp Quant Biol 26:35-43
Tolskaya EA, Romanova LI, Blinov VM, Viktorova EG, Sinyakov AN,
Kolesnikova MS, Agol VI (1987) Studies on the recombination between RNA genomes of
poliovirus: the primary structure and nonrandom distribution of crossover regions in the
genomes of intertypic poliovirus recombinants. Virology
161:54-61
Tomizawa J (1984) Control of ColE1 plasmid replication: the
process of binding of RNA I to the primer transcript. Cell
38:861-870
Turner DH, Sugimoto N, Freier SM (1988) RNA structure
prediction. Annu Rev Biophys Chem 17:167-192
Vartanian JP, Meyerhans A, Asjo B, Wain-Hobson S (1991)
Selection, recombination and G-A hypermutation of human immunodeficiency virus type 1
genomes. J Virol 65:1779-1788
Wagner RE, Radman M (1975) A mechanism for initiation of genetic
recombination. Proc Natl Acad Sci USA
72:3619-3622
Zoubak S, Richardson JH, Rynditch A, Hollsberg P, Hafler DA,
Boeri E, Lever AML, Bernardi G. (1994) Regional specificity of HTLV-1 proviral integration
in the human genome. Gene 143:155-163
Zuker M (1989) Computer prediction of RNA secondary structure. Meth Enzym 180:262-289

End
Note (June 2007)
|
Supporting
the observations of Bronson and Anderson (1994) in retroviruses, Sampath
et al. (2007) have found for influenza virus, that different
"evolving virus species" can be differentiated on the basis of
base composition ("Base composition derived clusters inferred from
this analysis showed 100% concordance to previously established clades.").
The authors did not consider whether the differences in base composition
followed or were a concomitant to phenotypic changes (novel antigens), or preceded
those changes (thus being implicated in the speciation process).
Sempath, R. et al. (2007) PLOS
One 2(5), e489. Global surveillance of emerging
influenza virus genotypes by mass spectrometry. |

End Note (March 2011)
|
Supporting
our above observations, Sanjuan and Borderia conclude (2011) for HIV-1
that "RNA structure and proteins do not evolve independently. A negative
correlation exists between the extent of base pairing in the genomic RNA
and amino acid variability."
Sanjuan R, Borderia AV (2011)
Molecular Biology & Evolution 28 (4),
1333-1338. Interplay between RNA structure and protein evolution in
HIV-1. |

End Note (May 2011)
|
Further analyses of HIV-1 and influenza virus RNA
structures again support our case that there is potential conflict
between the needs of genome structure and other functions. For example,
for influenza virus, Moss et al. note that "RNA structural constraints
lead to suppression of variation in the third (wobble) position of amino
acid codons." Instead of FORS-D they use the original Le-Maizel Z-score
terminology. Viral plus and minus
strands display asymmetrical folding energies, a feature discussed
elsewhere on these pages. (Click Here)
Moss WN, Priore SF, Turner DH (2011)
RNA 17,
991-1011. Identification of potential conserved RNA secondary structure
throughout influenza A codoing regions.
Watts
JM, Dang KK, Gorelick RJ, Leonard CW, et al. (2009)
Nature
460,
711-716. Architecture and secondary structure of an entire HIV-1 RNA
genome. |

End Note (Aug 2013)
|
Selection acting at synonymous coding positions is becoming more widely
recognized, even for the fruit fly genome (Lawrie et al. 2013). A preprint in arXiv by Zanini and Neher (2013) is of high relevance to
the above, which it cites.
I recently placed a historical review of
the field at arXiv (Forsdyke 2013). The title of a paper by Mayrose et
al. (2013), puts the case quite succinctly!
Forsdyke DR (2013) Role of HIV RNA structure
in recombination and speciation.
http://arxiv.org/abs/1305.2132
Lawrie DS, Messer PW, Hershberg R, Petrov DA
(2013) Strong purifying selection at synonymous sites in D.
melanogaster. PLOS Genetics 9 e1003527.
Mayrose I, et
al. (2013) Synonymous site conservation in the HIV-1
genome. BMC
Evolutionary Biology
13:164.
Zanini F, Neher RA (2013) Deleterious
synonymous mutations hitchhike to high frequency in HIV env evolution.
http://arxiv.org/pdf/1303.0805.pdf . |

Go to:
HIV Recombination and Speciation (2013) (Click Here)
Return to:
AIDS Page (Click Here)
Return to: Bioinformatics
Page (Click Here)
Return to: Evolution
Index Page (Click Here)
Return to: HomePage
(Click Here)

This page was established
circa 1998 and last edited on
01 September 2014 by Donald Forsdyke

 (Bernstein and Bernstein, 1991). Retroviruses transmit two
copies of their genomes to the cells they infect, and have high rates of recombination
(Coffin, 1992). Thus, if segments of the primary sequence
are functionally important for recombination (i.e. have stem-loops), keeping operational
these segments might be as important as keeping operational protein-encoding segments and
segments concerned with regulation. The latter two groups of segments,
when in regions under positive selection pressure (Scpaer and Mullins,
1993), may be
associated with negative FORS-D values since the sequences may not have been able to
optimize simultaneously both their function-encoding abilities and their folding
propensities. As these segments become less important for successful recombination (loss
of base order-dependent stem-loop potential), they are able to accept more substitutions
than segments better adapted for recombination (associated with high FORS-D values). The
proposed relationship between the conflicting evolutionary forces acting on the HIV-1
genome is summarized in Figure 12.