
Investing in Queen's, investing in people
The Queen's Endowment is an investment pool composed of funds that have been designated to university Endowment accounts. Donations received by the university are invested in the Queen's Endowment and each year certain amounts are withdrawn according to the Spending Policy. These annual withdrawals fund scholarships, academic chairs, book funds, lectureships, as well as a diverse range of university programs.
Subject to levels of risks acceptable under a "prudent portfolio" approach to investing funds of this nature, the primary objective of the Pooled Endowment Fund is to maximize risk adjusted returns in furtherance of two competing goals; the goal of releasing substantial income to support current operations and the goal of preserving the purchasing power of assets for future generations.
Tell us your story! We want to know what makes giving so important to you.
Endowment Overview

External Investment Managers
| Global Equities | TD Asset Management Inc. |
| Global Equities (Low Carbon) | TD Asset Management Inc. |
| Emerging Market Equities | Connor, Clark & Lunn |
| Ninety One | |
| US Small-Cap Equities | Fisher Investments |
| Fixed Income | BlackRock Inc. |
| Pacific Investment Management Company LLC | |
| TD Asset Management Inc. | |
| Private Equity* | 17Capital LLP |
| TorQuest | |
| Real Estate | OMERS (Oxford Properties) |
| TD Greystone | |
| Infrastructure | Brookfield |
| OMERS Infrastructure | |
| Pattern Energy |
*Managers of legacy private equity investments are not shown.

Annual Returns (before fees)
| Year | Mar-31 | Jun-30 | Sept-30 | Dec-31 |
|---|---|---|---|---|
| 2023 | 0.1% | 12.8% | 11.6% | 12.9% |
| 2022 | 8.6% | -4.9% | -6.8% | -6.5% |
| 2021 | 29.1% | 23.4% | 19.3% | 16.5% |
| 2020 | -3.9% | 3.9% | 7.2% | 11.4% |
| 2019 | 6.3% | 5.3% | 4.8% | 13.1% |
| 2018 | 6.0% | 7.7% | 7.9% | -0.2% |
| 2017 | 12.1% | 10.2% | 8.0% | 9.6% |
| 2016 | 2.0% | 5.0% | 10.0% | 8.1% |
| 2015 | 14.2% | 10.5% | 8.1% | 8.6% |
| 2014 | 16.1% | 18.7% | 15.3% | 11.6% |
| 2013 | 13.2% | 16.0% | 16.2% | 20.5% |
| 2012 | 3.4% | 1.7% | 14.6% | 12.3% |
| 2011 | 10.6% | 16.7% | 0.1% | 0.2% |
| 2010 | 24.4% | 7.8% | 7.0% | 9.4% |
| 2009 | -21.9% | -15.0% | 2.9% | 15.5% |
| 2008 | -3.4% | -4.6% | -14.4% | -21.5% |
| 2007 | 12.2% | 17.0% | 12.1% | 3.3% |
| 2006 | 12.7% | 6.5% | 8.3% | 14.8% |
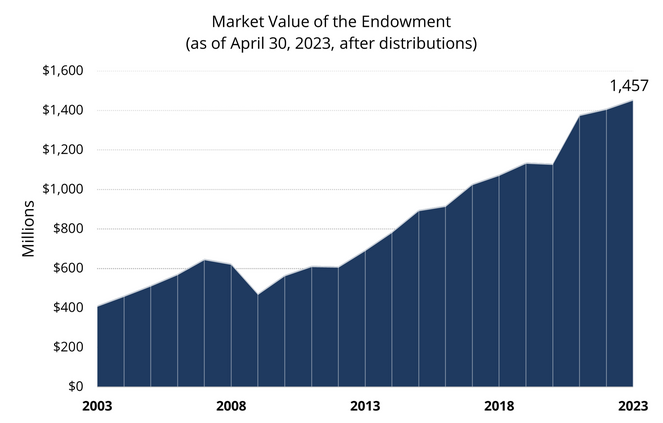
Asset Allocation and Market Value
The Queen's Endowment is well diversified across individual securities, asset classes, and geographies. The table below outlines the Strategic Policy Asset Mix for the fund.
| Asset Class | Asset Mix | Asset Mix Range |
|---|---|---|
| Equities (including Private Equity) | 65% | 45% - 75% |
| Fixed Income & Absolute Return | 13% | 0% - 40% |
| Real Assets | 20% | 0% - 30% |
| Cash and Short Term Investments | 2% | 0% - 20% |
The Investment Committee recommends the Strategic Policy Asset Mix to the Board of Trustees. The Strategic Policy Asset Mix is the long-term mix of assets that has been judged to be optimal for the Queen's Endowment. Based on its medium-term outlook, the Investment Committee employs a Target Asset Mix that falls within the Strategic Asset Mix Ranges. The Department of Investment Services monitors the actual asset allocation and rebalances the portfolio to the Target Asset Mix as required.
See a full report of the assets held within the Queen's Endowment.
The Investment Committee is responsible for establishing the spending policy for the Queen's Endowment, which is detailed in Section 5.7 of the fund's Statement of Investment Policies and Procedures:
The current policy has been approved by the Board of Trustees. The objective of the spending policy is to release substantial income while preserving the purchasing power of the assets for future generations.
The spending rule for Queen's attempts to achieve these objectives by using a long-term spending rate of 4.0% per annum combined with a smoothing rule that adjusts spending gradually to changes in endowment market value. The amount released under the spending rule is based on a 70% weight applied to the previous year's spending adjusted for inflation and a 30% weight applied to the amount that would have been spent using 4.0% per annum of current endowment market value. The spending formula includes a spending cap at 4.5% and a spending floor at 3.5%.
As a consequence of the smoothing rule, the spending payout has a lower volatility than that of the overall fund.
The Spending Policy will be reviewed annually by the Investment Committee.
The spending formula has two implications. First, by incorporating the previous year's spending, the rule eliminates large fluctuations and so enables the university to plan for its operating budget needs. Second, by adjusting spending toward a long-term rate of 4.0% of endowment market values, the rule ensures that spending levels will be sensitive to fluctuating endowment market value levels, providing stability in long-term purchasing power.
The endowment fund's payout is set annually based on the prior calendar year's ending market value. The payout for the 2023/2024 fiscal year is 16.31 cents per unit, implying a spending rate of 4.2%:
(70% x 2022/23's payout x (1 + Inflation rate)) + (30% x Long-term spending rate x December 31, 2022 unit value)
(70% x 15.75 cents x (1 + 5.4%)) + (30% x 4.0% x $3.9096) = 16.31 cents
Over the past decade, the payout has ranged between 9.24 and 15.75 cents per unit, implying a spending rate of between 3.4% - 3.9%.
The Queen's Endowment operates in a similar manner to a mutual fund. The value of a unit is determined by dividing the total current market value of the fund by the number of units outstanding. This value is calculated monthly by the Department of Financial Services and will increase or decrease according to investment performance.
Donations received by Queen's are unitized at the end of each month at the prevailing unit value. Income is then credited to the donor-specified cause based on the number of units held and the current dividend rate, as established by the Investment Committee.
Queen's Endowment Unit Value
The monthly value of a Queen’s Endowment fund unit is shown below.
| Date | Unit Value |
|---|---|
| February 29, 2024 | 4.3607 |
| January 31, 2024 | 4.2364 |
| December 31, 2023 | 4.2211 |
| November 30, 2023 | 4.1373 |
| October 31, 2023 | 3.9491 |
| September 30, 2023 | 4.0070 |
| August 31, 2023 | 4.1375 |
| July 31, 2023 | 4.1986 |
| June 30, 2023 | 4.1324 |
| May 31, 2023 | 4.0324 |
| April 30, 2023 | 4.0602 |
| March 31, 2023 | 4.0375 |
| February 28, 2023 | 4.0127 |
| January 31, 2023 | 4.0518 |
| December 31, 2022 | 3.9096 |
| November 30, 2022 | 4.0337 |
| October 31, 2022 | 3.8680 |
| September 30, 2022 | 3.7546 |
| August 31, 2022 | 3.9280 |
| July 31, 2022 | 3.9896 |
| June 30, 2022 | 3.8354 |
| May 31, 2022 | 4.0212 |
| April 30, 2022 | 4.0302 |
| March 31, 2022 | 4.2175 |
| February 28, 2022 | 4.1933 |
| January 31, 2022 | 4.2483 |
| December 31, 2021 | 4.3723 |
| November 30, 2021 | 4.2773 |
| October 31, 2021 | 4.2815 |
| September 30, 2021 | 4.2060 |
| August 31, 2021 | 4.2692 |
| July 31, 2021 | 4.2212 |
| June 30, 2021 | 4.2044 |
| May 31, 2021 | 4.1171 |
| April 30, 2021 | 4.0944 |
| March 31, 2021 | 4.0400 |
| February 28, 2021 | 3.9581 |
| January 31, 2021 | 3.8945 |
| December 31, 2020 | 3.9040 |
| November 30, 2020 | 3.8272 |
| October 31, 2020 | 3.6030 |
| September 30, 2020 | 3.6712 |
| August 31, 2020 | 3.7102 |
| July 31, 2020 | 3.6351 |
| June 30, 2020 | 3.5506 |
| May 31, 2020 | 3.5381 |
| April 30, 2020 | 3.4628 |
| March 31, 2020 | 3.2648 |
| February 29, 2020 | 3.5354 |
| January 31, 2020 | 3.6621 |
| December 31, 2019 | 3.6566 |
| November 30, 2019 | 3.6400 |
| October 31, 2019 | 3.5783 |
| September 30, 2019 | 3.5729 |
| August 31, 2019 | 3.5491 |
| July 31, 2019 | 3.5647 |
| June 30, 2019 | 3.5627 |
| May 31, 2019 | 3.5110 |
| April 30, 2019 | 3.5780 |
| March 31, 2019 | 3.5436 |
| February 28, 2019 | 3.5072 |
| January 31, 2019 | 3.4546 |
| December 31, 2018 | 3.3698 |
| November 30, 2018 | 3.4715 |
| October 31, 2018 | 3.4361 |
| September 30, 2018 | 3.5547 |
| August 31, 2018 | 3.5746 |
| July 31, 2018 | 3.5598 |
| June 30, 2018 | 3.5275 |
| May 31, 2018 | 3.5138 |
| April 30, 2018 | 3.4864 |
An amount is withdrawn annually from the Queen's Endowment fund to recover a portion of the internal administrative expenses relating to endowment management. This year, $2,087,000 is being withdrawn for this purpose, which amounts to approximately 0.14% of the Queen's Endowment's total assets. This amount is exclusive of fees related to external investment management. Current combined investment and administrative annual expenses are approximately 0.39% of total assets, plus HST. This figure excludes fees for our private equity investments, the returns for which are reported net of fees.