Thermophilic Bacteria Strictly Obey Szybalski’s Rule
|
There are few environments on this planet where living organisms are not found. Hot springs, oceanic thermal vents and radioactive discharges of nuclear reactors all contain living organisms (extremophiles). Fortunately, since heat and radiation are convenient ways of achieving sterilization in hospitals, none of these organisms has been found (or genetically engineered to become) seriously pathogenic (so far). Thermophiles are so-called because they thrive at high temperatures. Proteins purified from thermophiles often show high stability at normal temperatures, a feature that has attracted commercial interest (e.g. the proteins have a long shelf life). Hence, the full genomic sequences of many prokaryotic thermophiles (eubacteria and archaebacteria) are now available. Some thermophiles normally live at the temperature of boiling water. Nucleic acids in solution at this temperature soon degrade. So how do nucleic acids survive in thermophiles? The secondary structure of nucleic acids with a high GC% is more stable than that of nucleic acids with a low GC%. This is consistent with Watson-Crick G-C bonds being strong, and A-T (or A-U) bonds being weak. Do thermophiles have high GC-rich DNA? Not usually. But they do have AG-rich single-strands of DNA. Why? |
![]()
PAPERS
Thermophilic Bacteria and Szybalski's Rule Click Here
Preferential Gain of A and loss of C with Increase in Optimum Growth Temperature Click Here
GC% in thermophiles not supportive of neutralist argument (Click Here)
![]()
| Thermophilic Bacteria
Strictly Obey Szybalski’s Transcription Direction Rule and Politely Purine-Load
RNAs with Both Adenine and Guanine
Perry J. Lao and Donald R. Forsdyke Genome Research (2000) 10, 1-20 With copyright permission from the Editor, Laurie Goodman, for Cold Spring Harbor Laboratory Press (Click Here)
|
|
![]()
Large Chargaff Differences in Methanococcus jannaschii
Quadrant Analysis of Methanococcus jannaschii
Large Chargaff Differences in other Thermophiles
More Purine-Loading at Low (C+G)%
Genome-Wide Distribution of Purine-Loading
Influence of the Origin of Replication?
Same Optimum Window for Thermophiles and Non-Thermophiles
Purine-Loading Affects Codon ChoiceAn Adaptation for Survival at High Temperatures
The Politeness Hypothesis
Exceptions to Szybalski's Rule
Purine-Loading may Affect the Composition of Proteins
Which Purine to Use?
![]()
When transcription is to the right of the promoter the "top", mRNA-synonymous, strand of DNA tends to be purine-rich. When transcription is to the left of the promoter, the top, mRNA-template, strand, tends to be pyrimidine-rich. This "transcription-direction rule" suggests that there has been an evolutionary selection pressure for the purine-loading of RNAs. The "politeness" hypothesis states that purine-loading prevents distracting RNA-RNA interactions and excessive formation of double-stranded RNA, which might trigger various intracellular alarms. Since RNA-RNA interactions have a distinct entropy-driven component, the pressure for the evolution of purine-loading might be greater in organisms living at high temperatures. In support of this, we find that Chargaff differences (a measure of purine-loading) are greater in thermophiles than in non-thermophiles and extend to both purine bases. In thermophiles the pressure to purine-load affects codon choice, indicating that some features of their amino acid composition (e.g. high levels of glutamic acid) might reflect purine-loading pressure (i.e. constraints on mRNA) rather than direct constraints on protein structure and function. |
Duplex DNA can be represented as two horizontal lines, representing "top" (5’->3’) and "bottom" (3’->5’) strands. When transcription is to the right of the promoter the top, mRNA-synonymous, strand tends to be purine-rich. When transcription is to the left of the promoter, the top, mRNA-template, strand, tends to be pyrimidine-rich (Szybalski et al. 1966; Smithies et al. 1981). It follows that mRNAs, whatever the direction of their transcription, tend to be purine-rich (Dang et al. 1998; Bell et al. 1998). Usually one of the two purine bases is most heavily involved in "purine loading", and the other may appear indifferent. For organisms of low genomic (C+G)% the purine is usually A. For organisms of high (C+G)% the purine is usually G. The extra purines are located in the loop regions of computer-folded mRNA structures (Bell and Forsdyke 1999a,b). To explain the phenomenon of purine-loading, it was pointed out that the physical and chemical state of the " crowded" cytosol (Fulton 1982; Forsdyke 1995) is probably adapted to facilitate a reaction of fundamental importance, tRNA-mRNA interaction. This connection between genotype and phenotype (mRNA translation) must occur rapidly and with high specificity. If cytosolic conditions were such as to optimize this process, then there would be an increased probability not only of efficient tRNA-mRNA interactions, but also of efficient mRNA-mRNA interactions. These would initiate by way of "kissing" between the loops of folded RNAs (Eguchi et al. 1991). Such interactions might
Thus, there would have been a selection pressure for mRNAs to be "polite" (Zuckerkandl 1986) and avoid unnecessary interactions. This would have been achieved, wherever compatible with other mRNA functions, by loading loops of all mRNAs with non-Watson-Crick pairing bases (e.g. all purines or all pyrimidines). Exploratory "kissing" interactions between hybridizing nucleic acids involve transient stacking interactions (Eguchi et al. 1991) with the exclusion of structured water. Such reactions have a strong entropy-driven component (Cantor and Schimmel 1980), and so might increase as temperature increases (Lauffer 1975). Hence, perhaps counter-intuitively, nucleic-acids should be more "sticky" at high temperatures and the selection pressure to avoid formation of double-stranded RNA should be greater. To examine this, we here compare the magnitude (evaluated as Chargaff differences) and range (one or both purines) of purine-loading in the genomes of thermophilic bacteria, with those of the genomes of mesophilic bacteria which normally exist at 37C or lower temperatures. We also examine the extent to which the pressure to purine-load has affected codon choice, and hence, potentially, protein composition and function. |
Large Chargaff Differences in Methanococcus jannaschii
|
|
| Figure 1. Variation of
Chargaff differences (%) and purine/pyrimidine (R/Y) ratios along the
first 20 kb of the genomic sequence of the thermophile Methanococcus
jannaschii. A 1 kb sequence window was moved in steps of 0.1 kb and base compositions were determined in each window. From these, Chargaff differences (yellow circles for the W bases, and dark red squares for the S bases), and R/Y ratios (continuous red line), were calculated. Data points are located at the centre of each window. The locations of putative ORFs are shown as boxes (white for transcription to the left and grey for transcription to the right; orientations are also marked by horizontal arrows below each box). While most ORFs correspond to hypothetical proteins, some tentatively identified ORFs have been labelled: aspB1, aspartate aminotransferase; activ, activator of 2-hydroxyglutaryl-CoA dehydratase; formate dehyd., a and b subunits of formate dehydrogenase; glutar, b subunit of 2-hydroxyglutaryl-CoA dehydratase; pyruvate decarb., phosphonopyruvate decarboxylase; transposase; gatB, Asp-tRNA amidotransferase, subunit B. |
Fig. 1 shows a plot of Chargaff differences (%) along a segment of the genome of the thermophilic bacterium Methanococcus jannaschii. In previous studies of non-thermophilic organisms, such plots had to be carefully examined to see whether the S bases or the W bases were the best predictors of transcription direction in accordance with Szybalski's transcription direction rule. Chargaff differences were seldom greater than 20% (especially Chargaff differences for the S bases), and simply plotting the ratio of purines to pyrimidines (R/Y) was not particularly informative (Dang et al. 1998; Bell et al. 1998; Bell and Forsdyke 1999a,b). In contrast, for Methanococcus jannaschii it is observed that
Even a small rightward-transcribed ORF (in the 15.5-15.8 kb region), which is surrounded by leftward-transcribed ORFs, is detectable as a small dip in the S-base plot (G>C), although the W-base plot is not affected. No ORF has been reported at the beginning of the sequence (1-2 kb region), but the curve pattern (A>T; G>C) predicts that any ORFs found here should be transcribed to the right of the promoter. Quadrant Analysis of Methanococcus jannaschii To show that these features of a 20 kb segment (Fig. 1) are typical of the whole genome, the two Chargaff differences (for the W bases and for the S bases) were plotted against each other to generate "quadrant plots" (Bell et al. 1998) for leftward-transcribed ORFs (Fig. 2a), and for rightward-transcribed ORFs (Fig.2b). Each point in such plots represents a 1 kb window. Since Methanococcus jannaschii is 1.66 mb, and windows are taken at 0.1 kb intervals, there are several thousand points in each plot. For windows whose centers overlap leftward-transcribed ORFs, most points indicate enrichment both in T and C, implying that the corresponding mRNA synonymous strands would be enriched both in A and G. For windows whose centers overlap rightward-transcribed ORFs, most points indicate enrichment both in A and G, again implying that the mRNA synonymous strands are enriched both in A and G. |
|
|
Figure 2. Quadrant analysis of
Chargaff differences (%) for the W bases and the S bases
in 1 kb windows from the "top" strand of the Methanococcus jannaschii genome. Each quadrant corresponds
to windows enriched for two particular bases, as indicated at the corners.
The diagonal lines are the least squares regression lines. Listed are values for intercepts at the ordinate (Y0), slopes (Sl), squares of correlation coefficients (r2), and probabilities that slopes are not significantly different from zero (P). Similar values were obtained for plots using every tenth window to avoid window overlap (e.g. P<0.0001). |
As in Figure 1, Chargaff differences for the S bases are generally greater than those for the W bases (e.g. in Figure 2b points are generally further to the left of the ordinate, indicating G-richness, than they are above the abscissa, indicating A-richness). Although widely scattered, the points fit linear regressions sloping downward, so that, as suggested by Figure 1, it is likely that windows enriched in one pyrimidine are also enriched in the other (Fig. 2a), and that windows enriched in one purine are also enriched in the other (Fig. 2b). Large Chargaff Differences in other Thermophiles The extreme purine-loading found for the entire genome of Methanococcus
jannaschii was also found for large segments of the genomes of two other thermophilic
bacteria (Table 1). |
| . | Chargaff difference (%) | . | Base composition of average 1 kb windowb | . | Purine- loading indexc |
|||||||||||||
| Bacterium | Genome Segment | . | Transcriptional orientation | Leftward-transcribed | . | Rightward-transcribed | ||||||||||||
| (C+G)% | lengtha | Leftward | Rightward | A | C | G | T | A | C | G | T | |||||||
| Thermophilic | ||||||||||||||||||
| Methano- bacterium thermoauto- trophicum | 49.5 | 245 kb | (A-T)/W | T>A -9.440.25d | A>T 7.960.27 | . | 229 | 268 | 227 | 276 | . | 273 | 235 | 260 | 232 | . | 153 | |
| . | (C-G)/S | C>G 8.160.21 | G>C -4.910.21 | A-T=-47 | C-G =41 | A-T = 40 | C-G =-25 | . | ||||||||||
| . | ||||||||||||||||||
| Aquifex aeolicus | 43.4 | 248 kb | (A-T)/W | T>A -12.750.36 | A>T 9.860.36 | . | 247 | 239 | 195 | 319 | . | 311 | 199 | 235 | 255 | . | 208 | |
| . | (C-G)/S | C>G 10.210.29 | G>C -8.300.24 | A-T=-72 | C-G=44 | A-T = 56 | C-G =-36 | . | ||||||||||
| . | ||||||||||||||||||
| Methano- coccus jannaschii | 31.4 | genome | (A-T)/W | T>A -9.780.09 | A>T 9.920.09 | . | 309 | >195 | 119 | 377 | . | 377 | 119 | 195 | 309 | . | 288 | |
| . | (C-G)/S | C>G 24.060.15 | G>C -24.160.14 | A-T = -68 | C-G=76 | A-T = 68 | C-G=-76 | . | ||||||||||
| Non-thermophilic | ||||||||||||||||||
| Escherichia colie | 50.7 | 200 kb | (A-T)/W | T>A -1.50.3 | T>A -1.30.3 | . | 243 | 255 | 252 | 250 | . | 243 | 234 | 273 | 250 | . | 42 | |
| . | (C-G)/S | C>G 0.50.2 | G>C -7.60.1 | A-T = -7 | C-G = 3 | A-T = -7 | C-G = -39 | . | ||||||||||
| . | ||||||||||||||||||
| Mycoplasma pneumoniae | 40 | genome | (A-T)/W | T>A -5.490.20 | A>T 3.080.28 | . | 284 | 204 | 196 | 316 | . | 309 | 197 | 203 | 291 | . | 64 | |
| . | (C-G)/S | C>G 1.870.16 | G>C -1.520.21 | A-T = -32 | C-G =8 | A-T = 18 | C-G = -6 | . | ||||||||||
| . | ||||||||||||||||||
| Haemophilus
influenzaee |
38.1 | 350 kb | (A-T)/W | A>T 0.30.2 | A>T 2.10.2 | . | 310 | 210 | 171 | 309 | . | 316 | 184 | 197 | 303 | . | 64 | |
| . | (C-G)/S | C>G 10.20.2 | G>C -3.60.2 | A-T = 1 | C-G =39 | A-T = 13 | C-G =-13 | . | ||||||||||
|
Legend to Table 1 (a) Analysis involved either entire genomes (Methanococcus jannaschii , 1665 kb; Mycoplasma pneumoniae, 816 kb) or large segments (Methanobacterium thermoautotrophicum, 374431-619430; Aquifex aeolicus, 871431-1119930; Escherichia coli, 1-200000; Haemophilus influenzae, 1-350000). (b) Base composition for an average window in each category (leftward-transcribed or rightward transcribed), with Chargaff differences (A-T and C-G) expressed as base excesses. The mean pyrimidine excess in leftward-transcribed ORFs of the three thermophiles ([88 + 116 + 144]/[3]), is greater (P = 0.012; paired t-test with two degrees of freedom) than that of the three non-thermophiles ([10 + 40 + 38]/[3]). The mean purine excess in rightward-transcribed ORFs of the three thermophiles ([65 + 92 + 144]/[3]) is greater (P = 0.10) than that of the three non-thermophiles ([32 + 24 + 26]/[3]). (c) The purine-loading index is the sum of the four absolute Chargaff difference values (base excesses) when they relate positively to purine-loading (i.e. excess pyrimidines when transcription to the left and excess purines when transcription is to the right). All three thermophilic bacteria fulfil this criterion (mean value 216.3 39.2 bases/kb). The absolute values are subtracted from the sum when Chargaff differences relate negatively to purine-loading (e.g. T >A for rightward-transcribed ORFs in E. coli). Thus, for the three non-thermophilic bacteria the mean value is 56.7 7.7 bases/kb. (d) Each Chargaff difference value (%) is presented the standard errors of the mean. (e) These data are from Bell et al. 1998. | ||||||||||||||||||
The difference between thermophiles and non-thermophiles was more readily appreciated when the four Chargaff differences values (base excesses) for each organism were combined to provide an index of the purine-loading of the corresponding RNAs. For the thermophiles the index is simply the sum of the four absolute Chargaff differences, since the transcription rule is followed in each of the four cases. For the non-thermophiles, in cases where the transcription rule was not followed the corresponding values were subtracted from the overall sum. On average, the three thermophiles show more purine-loading than the three non-thermophiles (Table 1). Purine-loading in thermophiles ([153 + 208 + 288]/[3]) exceeds that of non-thermophiles ([42 + 64 + 64]/[3]) by 160 bases/kb window (P = 0.04; paired t-test with 2 degrees of freedom). More Purine-Loading at Low (C+G)% For thermophiles the purine-loading index shows an inverse linear relationship to (C+G)%, with a slope which is significantly different from zero (r2 = 0.994; P = 0.05). The relationship reflects purine-loading with G residues more than with A residues [i.e. with decreasing (C+G)% there is an increasing tendency for C-excess in leftward-transcribed ORFs and for G-excess in rightward-transcribed ORFs]. Thus, although there are fewer S bases available to support these excesses when the (C+G)% is low, those present are more readily utilized for the purine-loading function (i.e. they are likely to be locally unpaired in loops, rather than in stems). Whereas, in their absolute numbers, the S bases and the W bases contribute about equally to purine-loading in thermophilic bacteria, usually one class dominates in the non-thermophilic bacteria. Genome-Wide Distribution of Purine-Loading That large segments of genomes are likely to be representative of the entire genomes with respect to purine-loading was shown for Methanococcus jannaschii. The genome was divided into six segments of approx. 276.5 kb each. At this level of resolution, there are only minor fluctuations between segments in (C+G)%, Chargaff differences, and purine-loading indices (Table 2). For example, for rightward-transcribed ORFs the genomic average Chargaff difference (%) for the W bases is 9.92 0.09 (i.e. A>T; Table 1), and corresponding values for the six segments range from 8.46 to 10.57 The genome of Methanococcus jannaschii shows a remarkable symmetry between leftward and rightward ORFs in the actual numbers of S and W bases contributing to purine-loading (Table 1). Thus the average 1 kb window has pyrimidine-excesses of 68 (T) and 76 (C) for leftward-transcribed ORFs, and purine-excesses of 68 (A) and 76 (G) for rightward-transcribed ORFs. This tendency towards symmetry also occurs in the 6 segments (Table 2), and is precise in segment 2. |
|
Table 2. Comparison of Chargaff differences of six segments of Methanococcus jannaschiia
|
|||||||||||||||||||||||||||||||||||||||||||||||||||||||||||||||||||||||||||||||||||||||||||||||||||||||||||||||||||||||||||||||||||||||||||||||||||||||||||||||||||||||||||||||||||||||||||||||||||||||||||||||||||||||||||||||||||||||||||||||||||||||||||||||||||||||||||||||||||||||||||||||||||||||||||||||||||||||||||||||||||||||||||||||||||||||||||||||||||||||||||||||||||
|
Legend to Table 2 |
|||||||||||||||||||||||||||||||||||||||||||||||||||||||||||||||||||||||||||||||||||||||||||||||||||||||||||||||||||||||||||||||||||||||||||||||||||||||||||||||||||||||||||||||||||||||||||||||||||||||||||||||||||||||||||||||||||||||||||||||||||||||||||||||||||||||||||||||||||||||||||||||||||||||||||||||||||||||||||||||||||||||||||||||||||||||||||||||||||||||||||||||||||
|
Influence of the Origin of Replication? Although leftward and rightward ORFs are covered by approximately equal numbers of overlapping 1 kb windows (7494 and 8202, respectively), the distribution varies (Table 2). The number of windows corresponding to leftward ORFs tends to decrease with segment number, whereas the number of windows corresponding to rightward ORFs tends to increase with segment number. Since the Methanococcus jannaschii chromosome is circular, this indicates a sharp switch between segments 6 and 1 from a predominantly purine-rich top strand (reflecting an excess of windows covering rightward ORFs in segment 6) to a predominantly pyrimidine-rich top strand (reflecting an excess of windows covering leftward ORFs in segment 1). This probably relates to the origin of replication (site not currently known), since when windows much greater than 1 kb are used for Chargaff difference analysis (thus tending to obscure the local effects of individual ORFs), the results can provide a guide to the position of the origin of replication (Smithies et al. 1981; Lobry 1996). Same Optimum Window for Thermophiles and Non-Thermophiles In previous studies the optimum window (1 kb) for examining Chargaff differences was determined in a range of organisms by comparing natural with the corresponding shuffled sequences (Dang et al. 1998; Bell et al. 1998; Bell and Forsdyke 1999a). A similar study of the three thermophile genomes considered above indicated that a 1 kb window would also be optimum in these organisms. For example, for Figure 3 absolute Chargaff difference values were plotted against window size in a 276.5 kb segment of Methanococcus jannaschii. The difference between values of points on the curves for the natural and shuffled sequences reaches an optimum at a window size of about 1 kb. As with the non-thermophiles, the ratio of the values on these curves reaches an optimum at higher window sizes. It was concluded that it was appropriate to use 1 kb windows when comparing the Chargaff differences of thermophile and non-thermophile genomes. |
|
|
| Figure 3. Variation of average
Chargaff difference values with size of windows in Methanococcus jannaschii. Windows of varying size were moved along the first 276.5 kb of the genome in steps of 100 nt, and base compositions were determined in each window. Average absolute Chargaff differences (%) for each window size are plotted either as filled circles (natural sequence), or as opened circles (shuffled sequence). Red triangles refer to the difference between these values (the average Chargaff difference for the natural sequence less the average Chargaff difference for the shuffled sequence). Yellow diamonds refer to the ratio of these values. The total number of windows of a given size used to calculate average Chargaff differences varied with sequence length. Thus in a 100 kb sequence there would be 999 windows of 0.2 kb, and one window of 100 kb. |
|
Purine-Loading Affects Codon Choice The strong pressure on thermophiles to purine-load their mRNAs as revealed by Chargaff difference analysis, suggested that choice of synonymous codons might provide an independent measure of this evolutionary force. Furthermore, thermophiles show some regularities in amino acid compositions (Kagawa et al. 1984; Deckert et al. 1998; Jaenicke and Bohm 1998), raising the possibility that the choice of non-synonymous codons might also be affected. Table 3 shows data for some amino acids corresponding to purine-rich codons. In the case of glycine (4 codons) and arginine (6 codons) the opportunity is provided for choice of synonymous codon, and in both cases purine-rich codons are preferred by thermophiles. Thus, thermophiles prefer GGR over GGY, and non-thermophiles prefer GGY over GGR. This suggests a selection pressure acting at the nucleic acid level, rather than at the protein level. |
|
||||||||||||||||||||||||||||||||||||||||||||||||||||||||||||||||||||||||||||||||||||||||||||||||||||||||||||||||||||||||||||||||||||||||||||||||||||||||||||||||||||||||||||||||||||||||||||||||||||||||||||||||||||||||||||||||||||||||||||||||||||||||||||||||||||||||||||||||||||||||||||||||||||||||||||||||
|
Legend to Table 3 |
||||||||||||||||||||||||||||||||||||||||||||||||||||||||||||||||||||||||||||||||||||||||||||||||||||||||||||||||||||||||||||||||||||||||||||||||||||||||||||||||||||||||||||||||||||||||||||||||||||||||||||||||||||||||||||||||||||||||||||||||||||||||||||||||||||||||||||||||||||||||||||||||||||||||||||||||
|
There is a significant increase in codons for glutamic acid in the thermophiles, consistent with a selection pressure on non-synonymous codons. However, although there is a suggestion of a similar pressure for arginine, it is not found for aspartic acid or lysine. The thermophile Archaeoglobus fulgidus is very similar to the other thermophiles (Table 3), indicating that, in future work, purine-loading might also be demonstrable by the Chargaff difference method in this organism. |
|
An Adaptation for Survival at High Temperatures It is likely that Szybalski's transcription direction rule is a consequence of purine-loading, (Bell and Forsdyke 1999b). With this assumption, the difference between thermophilic bacteria and non-thermophilic bacteria in
suggests that adaptation for survival at high temperatures has required that mRNAs be more heavily purine-loaded. Consistent with this, in a survey of twelve chloroplast genomes (R. J. Rasile and D. R. Forsdyke, unpublished work) we find that those of the thermophile Cyanidium caldarium have a greater purine-loading index (108 bases/kb) than those of eleven non-thermophilic organisms (average 41.1 6.2 bases/kb). An extreme example of the latter is the genome of chloroplasts of the parasitic plant Epiphagus virginiana where the chloroplasts are degenerate so that pressure on mRNAs to be "polite" is likely to be decreased (purine-loading index only 22 bases/kb). The Gibb's free energy equation (DeltaG = DeltaH - T DeltaS) implies that, with increasing temperature, reactions with a significant entropy-driven component can occur more readily (Lauffer 1975). Since the base pairing involved in RNA-RNA interactions has a considerable entropic component (Cantor and Schimmel 1980), such interactions, whether desirable or undesirable, should be favored at high temperatures. Thus, if chemically and biologically feasible, it is possible that RNA sequences would have adapted to avoid undesirable interactions, while not impairing desirable ones. Purine-loading would seem to achieve this. In general, mRNAs "drive" politely on the purine "side of the road", and thermophile mRNAs appear excessively polite. The politeness is not trivial (contrast the "polite DNA" of Zuckerkandl 1986). Driving on the correct side of the road is conducive to efficient highway operation. Failure to do might be lethal if it led to the formation of dsRNA and the false triggering of intracellular alarms. Exceptions to Szybalski's Rule There are exceptions to Szybalski's rule (Cristillo 1998; Cristillo et al. 1998; Bell and Forsdyke 1999b). Certain viruses with a prolonged period of clinical latency load their mRNAs with pyrimidines. Thus while human immunodeficiency virus 1 (moderately committed to latency) is "polite" (mRNAs heavily purine-loaded), human T cell leukaemia virus 1 (profoundly committed to latency) is extremely "impolite" (mRNAs heavily pyrimidine-loaded). Epstein-Barr virus (like many other herpes viruses) is also profoundly committed to latency and pyrimidine-loads most of its RNAs. However, unlike human T cell leukaemia virus 1, Epstein-Barr virus has an important transcript expressed in all forms of latency, the transcript encoding the EBNA-1 antigen. Remarkably, this transcript is "polite", its purine-loading being amplified by inclusion of a simple-sequence element encoding, by preferential employment of purine-rich codons, a glycine-alanine repeat which can be removed without greatly affecting EBNA-1 function. Despite this, much current work is based on the premise that, in the compact virus genome, the simple-sequence element persists because of a function at the protein level rather than at the nucleic acid level (for references see Lee et al. 1999). Purine-Loading may Affect the Composition of Proteins Conventional natural selection provides an "extrinsic" pressure on the phenotype and so determines which genotypes will survive. However, it has long been recognized that genomes are also moulded by "intrinsic" forces (Romanes 1886; Forsdyke 1999b,c). One such force is a component of the base-composition of DNA, (C+G)%. This can affect protein composition, and hence possibly the phenotype (Sueoka 1961; Ball 1973; Grantham 1980; Bronson and Anderson 1994; Forsdyke 1996, 1998). In the light of the present work it appears that another component of base-composition, R/Y, may also affect protein composition, and hence possibly the phenotype. We have identified purine-loading as an evolutionary force, and have suggested an adaptive basis related to the intrinsic workings of the cell (Bell et al. 1998; Bell and Forsdyke 1999b; Forsdyke 1999a; Fire 1999). Thermophilic bacteria appear particularly susceptible to this force, so that in these organisms the pressure to purine-load RNA may have been powerful enough to affect choice both of synonymous and of non-synonymous codons. In thermophiles, an increase in the proportion of glutamic acid (encoded by codons containing only purines) has been noted (Deckert et al. 1998), and this is confirmed in Table 3. Although it is tempting to believe that all such changes in the amino acid composition of proteins are related to the need to maintain protein stability and function at high temperatures (Kagawa et al. 1984 ; Jaenicke and Bohm 1998), our results raise the possibility that the needs of efficient mRNA function at high temperatures may also have affected the composition of proteins. However, Jaenicke and Bohm (1998) find it difficult to define what they call "traffic rules" of thermophilic adaptation in terms of significant differences in amino acid composition. From our initial studies of the purine-loading phenomenon, the generalisation emerged that organisms with high (C+G)% genomes would preferentially load with G-residues, and organisms with low (C+G)% genomes would preferentially load with A-residues (Bell and Forsdyke 1999b). This seemed logical since organisms with a low (C+G)% would seem to have less flexibility for loading codons with scarce G-residues (e.g. the Gs would be required for critically placed codons, which might not match RNA loop regions). To our surprise, the present work (Table 1) indicates, either that this generalisation is not valid, or that thermophiles are a special case. Perhaps because the strength of bonding between the S bases is greater than that between the W bases, it may be the avoidance of C residues, as much as the inclusion of G residues, which generates such large Chargaff differences with respect to the S bases in thermophiles. The unpaired Gs would locate to the loop regions of stem-loop secondary structures. In considering this matter, one should also take into account the fact that nearest neighbours are of considerable importance in base pairing interactions (Turner 1996), and in low (C+G)% DNA an S base is more likely to have a W base nearest neighbour. |
|
Chargaff's first parity rule for duplex DNA (%A = %T; %C = %G) applies, to a close approximation, to single stranded DNA (Chargaff's second parity rule; Chargaff 1979). Deviations from parity are referred to as "Chargaff differences". The base-composition of successive 1 kb windows, moved in steps of 0.1 kb, was assessed as described by Dang et al. (1998). Chargaff differences were either calculated as (A-T)/W and (C-G)/S and expressed as percentages, or were expressed directly as positive or negative base-excesses (A-T, or C-G). Here, A, T, C and G refer to the number of the corresponding base in a window. The direction of subtraction (A-T or T-A) is determined alphabetically. W is the sum of the W bases (A+T) and S is the sum of the S bases (C+G). Purine-loading of mRNAs is indicated when the regions of top DNA strands corresponding to leftward-transcribed ORFs are enriched in pyrimidines and when the regions of top DNA strands corresponding to rightward-transcribed ORFs are enriched in purines. These enrichments may be assessed at the DNA level as Chargaff differences. Because the direction of subtraction is determined alphabetically, purine-loading has been supported when Chargaff differences for the W bases (A-T) are positive, and/or Chargaff differences for the S bases (C-G) are negative. An overall index of the purine-loading of RNA was obtained by summing absolute Chargaff difference values (positive or negative base excesses per 1 kb window) for the pyrimidine excess in leftward-transcribed ORFs and for the purine excess in rightward-transcribed ORFs. In circumstances where Szybalski's transcription direction rule was not followed, the corresponding absolute values were subtracted from the overall total. When both purines contributed to purine-loading, the latter was assessed as the purine/pyrimidine ratio (Y/R; usually expressed as a percentage). In some circumstances codon-choice provided a measure. Sequence information refers to the "top" strand as designated in the GenBank record. Genomic sequences examined were from Aquifex aeolicus (Deckert et al. 1998), Archaeoglobus fulgidus (Klenk et al. 1997), Escherichia coli (Blattner et al. 1997), Haemophilus influenzae (Fleischmann et al. 1995), Methanobacterium thermoautotrophicum (Smith et al. 1997), Methanococcus jannaschii (Bult et al. 1996), Mycoplasma genitalium (Fraser et al. 1995) and Mycoplasma pneumoniae (Himmelreich et al. 1996). These were analyzed with programs of the Genetics Computer Group (GCG), Madison, WI, and our own programs written as Unix scripts or in C++. Codon usage tables for complete genomes, calculated using the GCG program CodonFrequency, were obtained from C. Brown, Department of Biochemistry, University of Otago. ACKNOWLEDGEMENTS We thank Chris Brown for codon usage tables, Jim Gerlach for assistance with computer configuration, Gregory Hill for a program for determining optimum window sizes, and Robert Rasile for data on chloroplast genomes. The National Research Council of Canada, Academic Press, Cold Spring Harbor Laboratory Press, and Elsevier Publishing Corporation gave permission for the inclusion of full-text versions of relevant preceding papers at our internet site. REFERENCES Ball, L. A. 1973. Secondary structure and coding potential of the coat protein gene of bacteriophage MS2. Nature 310: 207-211. Bell, S. J., Y. C. Chow, J. Y. K. Ho, and D. R. Forsdyke. 1998. Correlation of Chi orientation with transcription indicates a fundamental relationship between recombination and transcription. Gene 216: 285-292. [Later correction 231: 213-213] Bell, S. J., and D. R. Forsdyke. 1999a. Accounting units in DNA. J. Theor. Biol. 197: 51-61. Bell, S. J., and D. R. Forsdyke. 1999b. Deviations from Chargaff’s second parity rule correlate with direction of transcription. J. Theor. Biol. 197: 63-76. Blattner, F. R. et al. 1997. The complete genome sequence of Escherichia coli K-12. Science 277: 1453-1474. Bronson, E. C., and J. N. Anderson. 1994. Nucleotide composition as a driving force in the evolution of retroviruses. J. Mol. Evol. 38: 506-532. Bult, C. J. et al., 1996. Complete genomic sequence of the methanogenic archaeon, Methanococcus jannaschii. Science 273: 1058-1072. Cantor, C. R., and P. R. Schimmel. 1980. Biophysical Chemistry, pp. 1183-1264. Freeman, San Francisco. Chargaff, E. 1979. How genetics got a chemical education. Ann. N. Y. Acad. Sci. 325: 345-360. Cristillo, A. R. 1998. Characterization of G0/G1 switch genes in cultured T lymphocytes. Ph.D. Thesis. Queen’s University, Kingston. Cristillo, A. D., T. P. Lillicrap, and D. R. Forsdyke. 1998. Purine loading of EBNA-1 mRNA avoids sense-antisense "collisions". FASEB. J. 12: A1453 (abstract no. 828). Dang, K. D., P. B. Dutt, and D. R. Forsdyke. 1998. Chargaff difference analysis of the bithorax complex of Drosophila melanogaster. Biochem. Cell Biol. 76: 129-137. Deckert, G., et al. 1998. The complete genome of the hyperthermophilic bacterium Aquifex aeolicus. Nature 392: 353-358. Eguchi, Y., T. Itoh, and J. Tomizawa. 1991. Antisense RNA. Annu. Rev. Biochem. 60: 631-652. Fire, A. 1999. RNA-triggered gene silencing. Trends Genet. 15: 358-363. Fleischmann, R. D. et al. 1995. Whole-genome random sequencing and assembly of Haemophilus influenzae Rd. Science 269: 496-512. Forsdyke, D. R. 1995. Entropy-driven protein self-aggregation as the basis for self/not-self discrimination in the crowded cytosol. J. Biol. Sys. 3: 273-287. Forsdyke, D. R. 1996. Different biological species "broadcast" their DNAs at different (C+G)% "wavelengths". J. Theor. Biol. 178: 405-417. Forsdyke, D. R. 1998. An alternative way of thinking about stem-loops in DNA. A case study of the G0S2 gene. J. Theor. Biol. 192: 489-504. Forsdyke, D. R. 1999a. Heat shock proteins as mediators of aggregation-induced "danger" signals: implications of the slow evolutionary fine-tuning of sequences for the antigenicity of cancer cells. Cell Stress Chaperones 4: 205-210. Forsdyke, D. R. 1999b. The origin of species revisited. Queen's Q. 106: 112-133. Forsdyke, D. R. 1999c. Two levels of information in DNA. Relationship of Romanes' "intrinsic" variability of the reproductive system, and Bateson's "residue", to the species-dependent component of the base composition, (C+G)%. J. Theor. Biol. 201: 47-61. Fraser, C. M., et al. 1995. The minimal gene complement of Mycoplasma genitalium. Science 270: 397-403. Fulton, A. B. 1982. How crowded is the cytoplasm? Cell 30: 345-347. Grantham, R. 1980. Workings of the genetic code. Trends Biochem. Sci. 5: 327-331. Himmelreich, R., H. Hilbert, H. Plagens, E. Pirkl, B-C. Li, and R. Herrmann. 1996. Complete sequence analysis of the genome of the bacterium Mycoplasma pneumoniae. Nucleic Acids Res. 24: 4420-4449. Jaenicke, R., and G. Bohm. 1998. The stability of proteins in extreme environments. Curr. Opin. Struct. Biol. 8: 738-748. Kagawa, Y., H. Nojima, N. Nukiwa, M. Ishizuka, T. Nakajima, T. Yasuhara, T. Tanaka, and T. Oshima. 1984. High guanine plus cytosine content in the third letter of codons of an extreme thermophile. J. Biol. Chem. 259: 2956-2960. Klenk, H-P., et al. 1997. The complete genome sequence of the hyperthermophilic sulphate-reducing archaeon Archaeoglobus fulgidus. Nature 390: 364-370. Lauffer, M. A. 1975. Entropy-Driven Processes in Biology. Springer-Verlag, New York. Lee, M-A., M. E. Diamond, and J. L. Yates. 1999. Genetic evidence that EBNA-1 is needed for efficient stable latent infection by Epstein-Barr virus. J. Virol. 73: 2974-2982. Lobry, J. R. 1996. Origin of replication of Mycoplasma genitalium. Science 272: 745-746. Romanes, G. J. 1886. Physiological selection: an additional suggestion on the origin of species. J. Linn. Soc. (Zool.) 19: 337-411. Smith, D. R., et al. 1997. Complete genome sequence of Methanobacterium thermoautotrophicum D H: functional analysis and comparative genomics. J. Bact. 179: 7135-7155. Smithies, O., W. R. Engels, J. R. Devereux, J. L. Slightom, and S-h. Chen. 1981. Base substitutions, length differences and DNA strand asymmetries in the human Gg and Ag fetal globin gene region. Cell 26: 345-353. Sueoka, N. 1961. Compositional correlation between deoxyribonucleic acid and protein. Cold Spring Harb. Sym. Quant. Biol. 26: 35-43. Szybalski, W., H. Kubinski, and O. Sheldrick. 1966. Pyrimidine clusters on the transcribing strand of DNA and their possible role in the initiation of RNA synthesis. Cold Spring. Harb. Symp. Quant. Biol. 31: 123-127. Turner, D. H. 1996. Thermodynamics of base pairing. Curr. Opin. Struct. Biol. 6: 299-304. Zuckerkandl, E. 1986. Polite DNA: functional density and functional compatibility in genomes. J. Mol. Evol. 24: 12-27. |
![]()
.
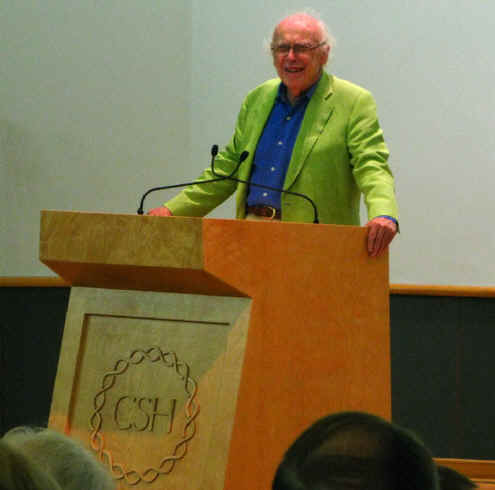
End Note (Sept 2010) Szybalski at Cold Spring Harbor
 |
 |
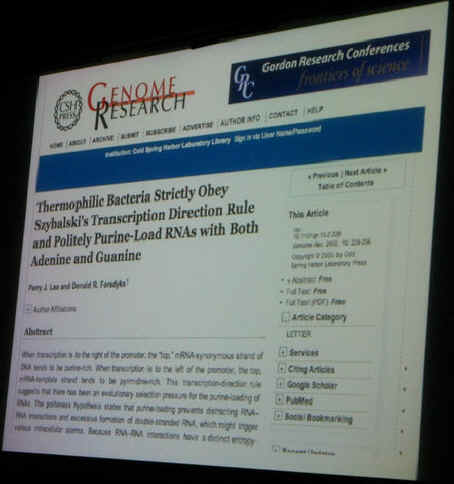 |
To his many honours in 2010 Waclaw Szybalski added the naming of the annex to the Carnegie Library at Cold Spring Harbor. James Watson opened the ceremonies and his first slide was the title and summary of the above article. Watson had corresponded with Forsdyke in 1976 concerning the third edition of his famous monograph Molecular Biology of the Gene that later became a multiauthor work (ClickHere) .
End Note (May 2016) Avoidance of RNA-RNA interactions
Detailed studies of RNA hybridization energetics suggest that there has been a selection pressure to prevent individual RNAs from unnecessarily interacting with other RNAs in the same species of biological organisms.
See Umu, Poole, Thomson & Gardner (2016) Natural avoidance of stochastic mRNA:ncRNA interactions can be harnessed to control protein expression levels: Here .
Go to: Preferential Gain of A and loss of C with Increase in Optimum Growth Temperature Click Here
Go to: GC% in thermophiles not supportive of neutralist argument (Click Here)
.
Return to: Bioinformatics Index (Click Here)
Return to: Homepage (Click Here)
.
Last edited on 07 May 2016 by Donald Forsdyke
 The thermophilic bacteria strictly comply with
Szybalski's transcription direction rule for both
Watson-Crick base pairs, and the magnitude of the differences is generally greater than in
the case of the non-thermophilic bacteria. The latter sometimes do not comply with respect
to one Watson-Crick base pair (for the E. coli segment
rightward-transcribed ORFs are slightly T-rich, and for the H.
influenzae segment leftward transcribed ORFs are slightly A-rich).
The thermophilic bacteria strictly comply with
Szybalski's transcription direction rule for both
Watson-Crick base pairs, and the magnitude of the differences is generally greater than in
the case of the non-thermophilic bacteria. The latter sometimes do not comply with respect
to one Watson-Crick base pair (for the E. coli segment
rightward-transcribed ORFs are slightly T-rich, and for the H.
influenzae segment leftward transcribed ORFs are slightly A-rich).