
Detect anomalous values, measure variability, and quantify similarity between regions using robust, non-parametric statistics.
Access the .m files through https://github.com/Renwick-Tyryshkin-Lab
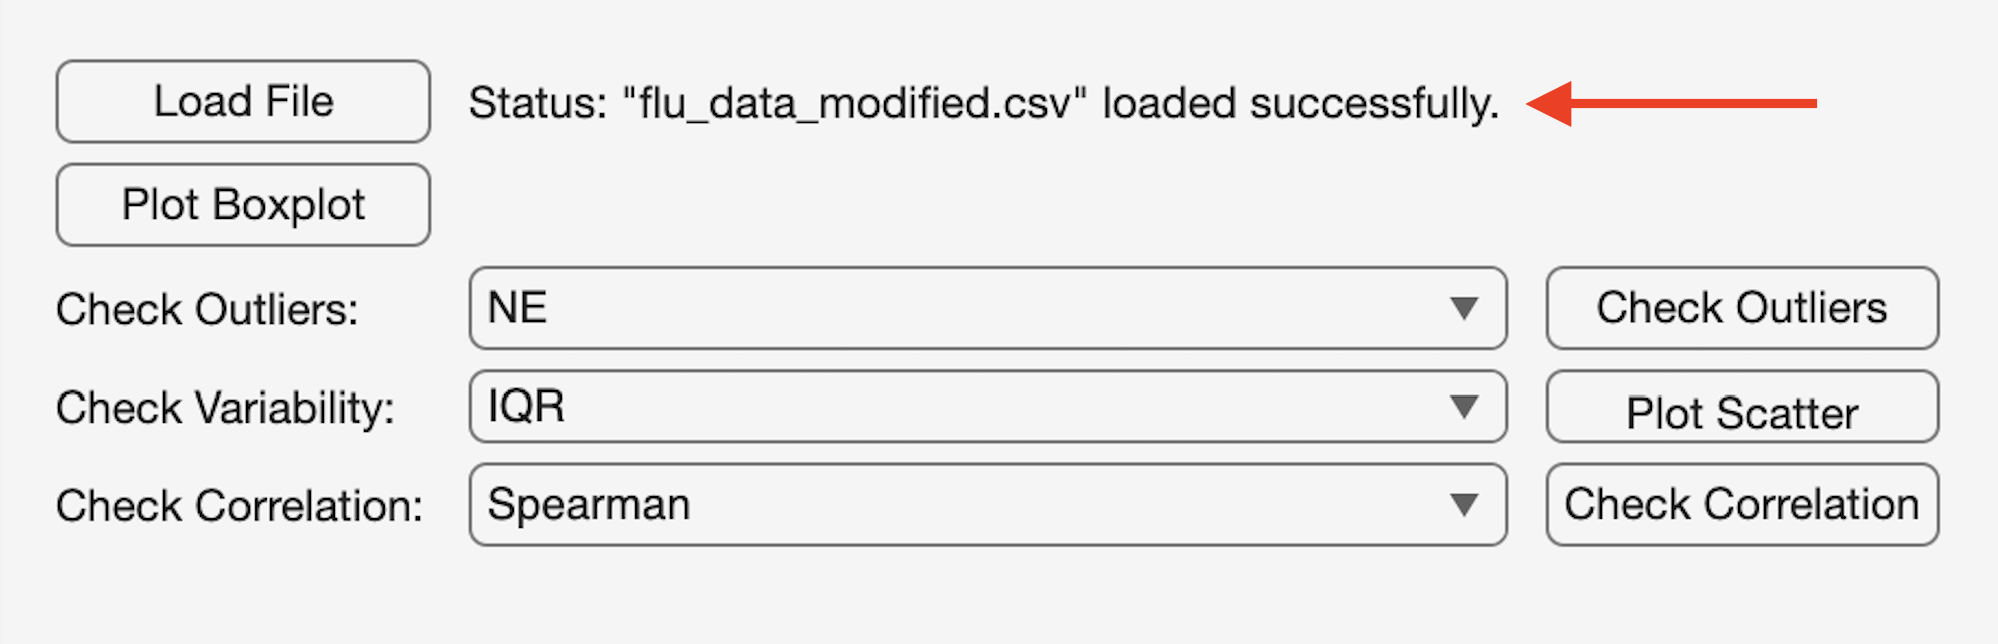
Load data
Load your data on the pop-up screen (CSV (.csv), MATLAB files (.mat) or Numeric matrices or tables)
Requirements:
Rows = observations / samples ; Columns = numeric variables
If your data contains text/names, for example: Male/Female, Control/Treated, Species names, etc. They must be converted before use (for example: Binary categories → 0 / 1)
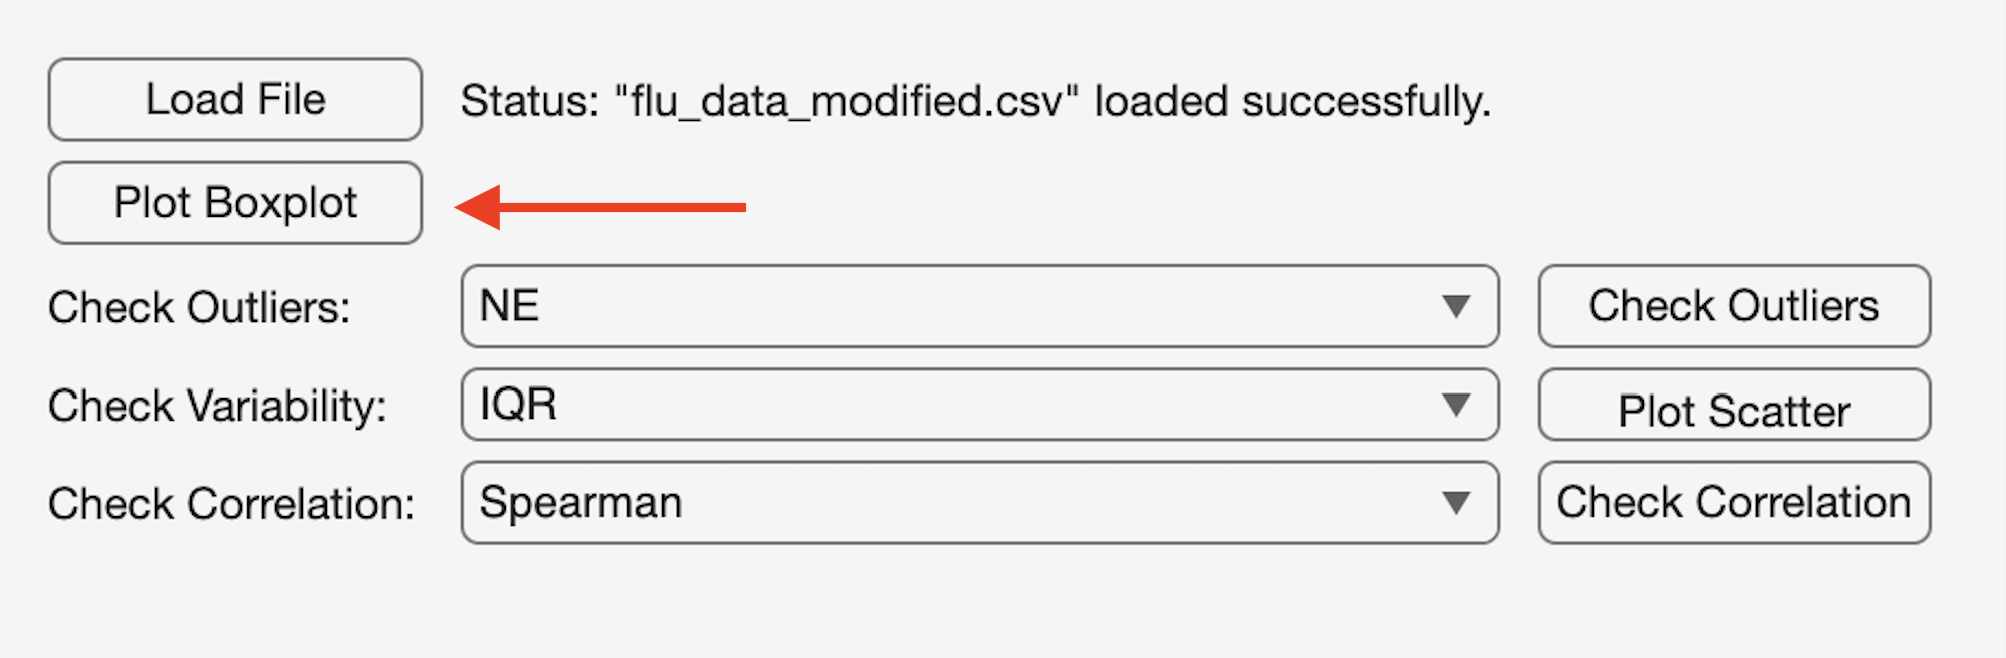
Boxplot
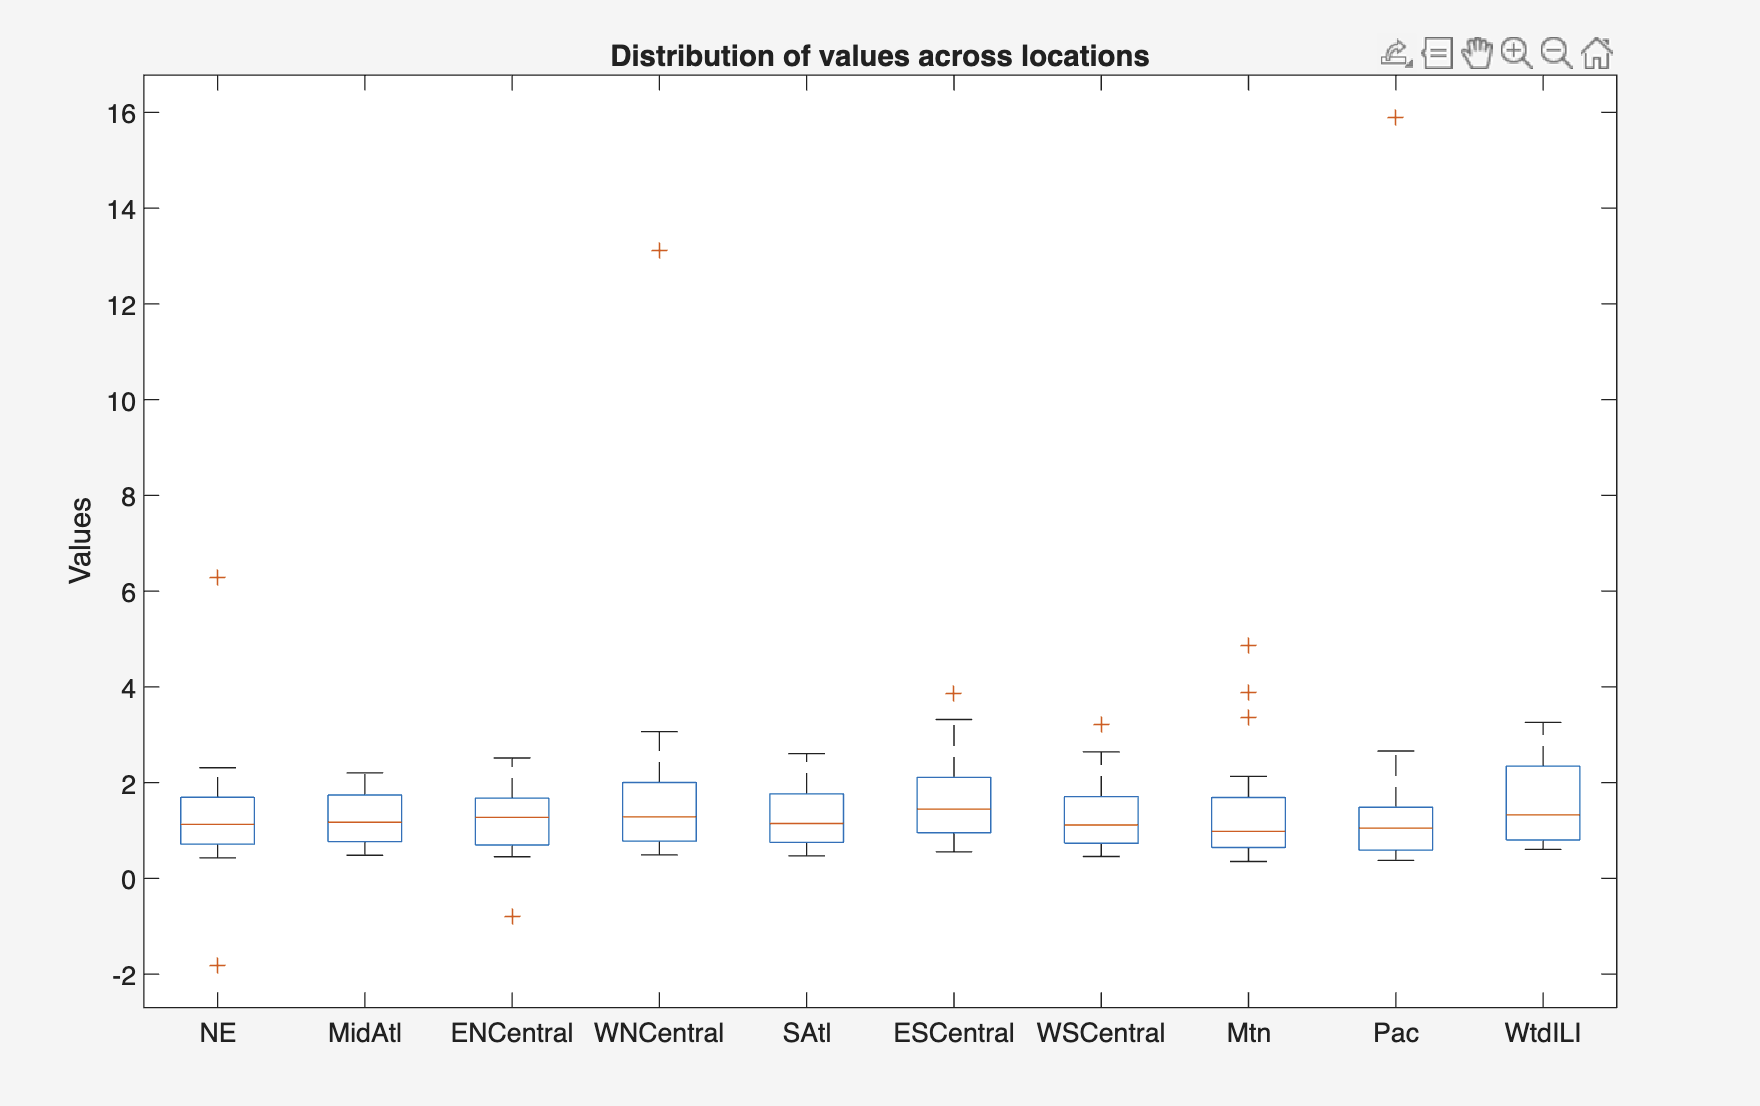
The boxplot provides a compact statistical summary of data distributions across multiple variables or groups:
Medium(central line)
Interquartile range (IQR) (box)
Whiskersrepresenting the typical data range
Outliers beyond 1.5 × IQR
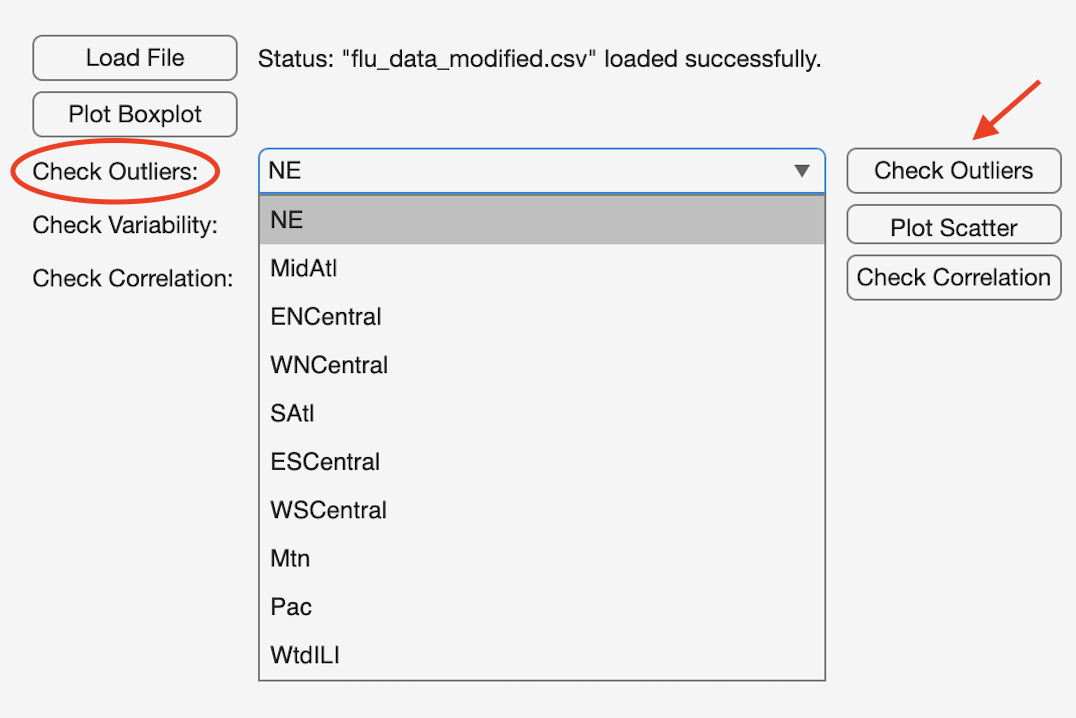
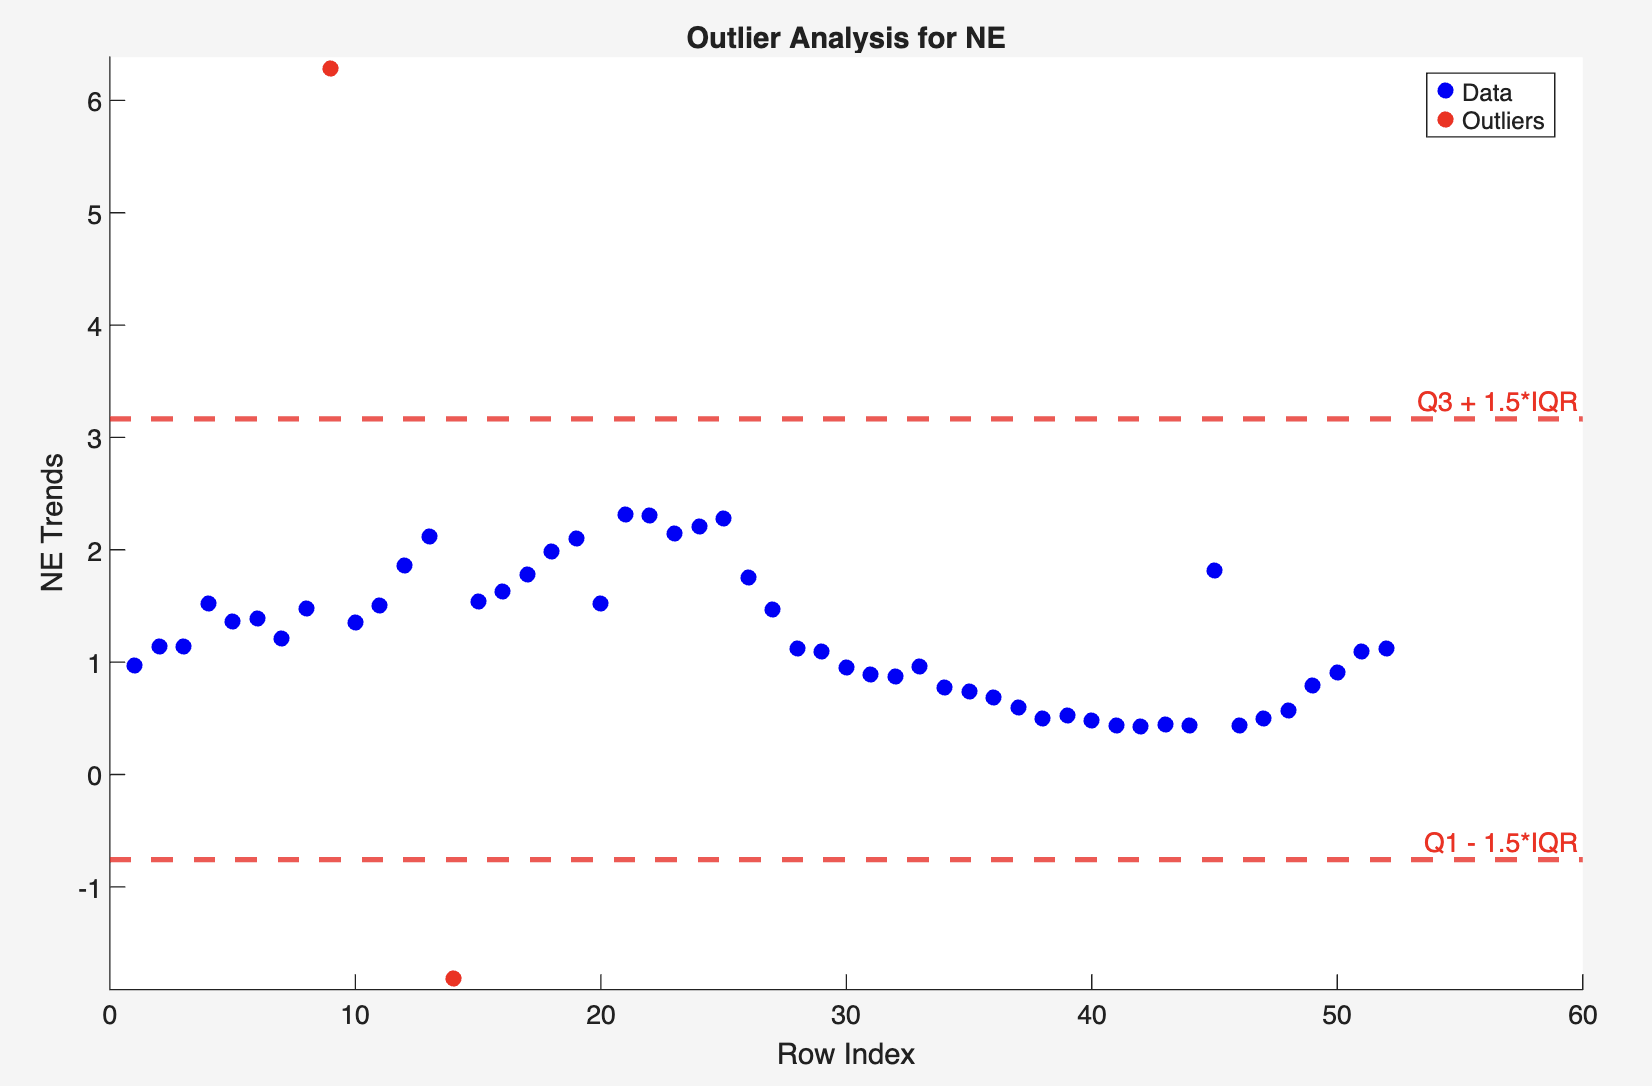
Outlier detection
Select a features from the dropdown list and identify outliers (red dots).
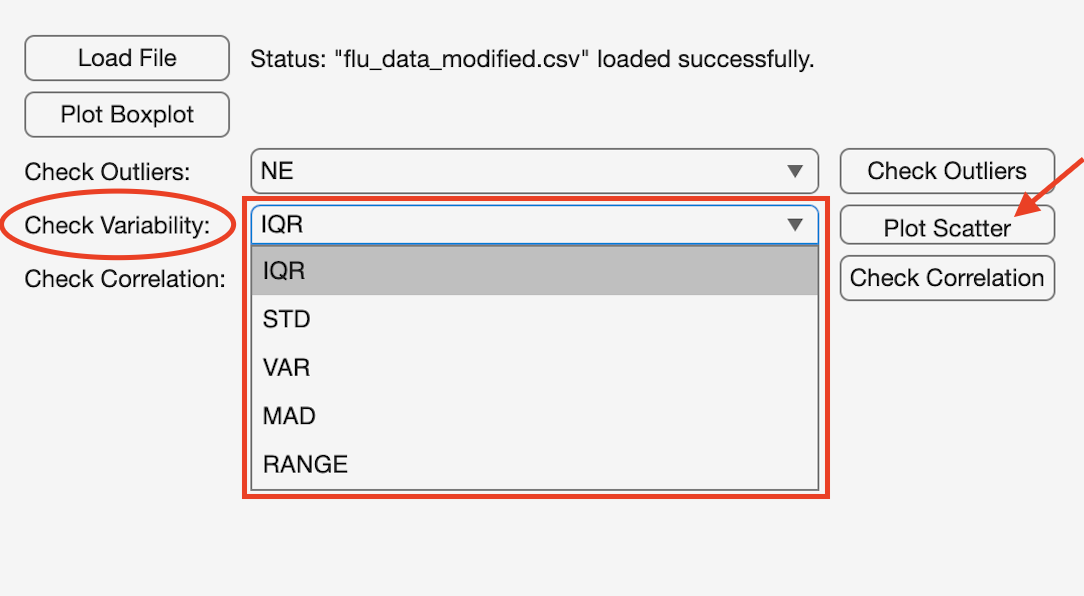
Variability analysis
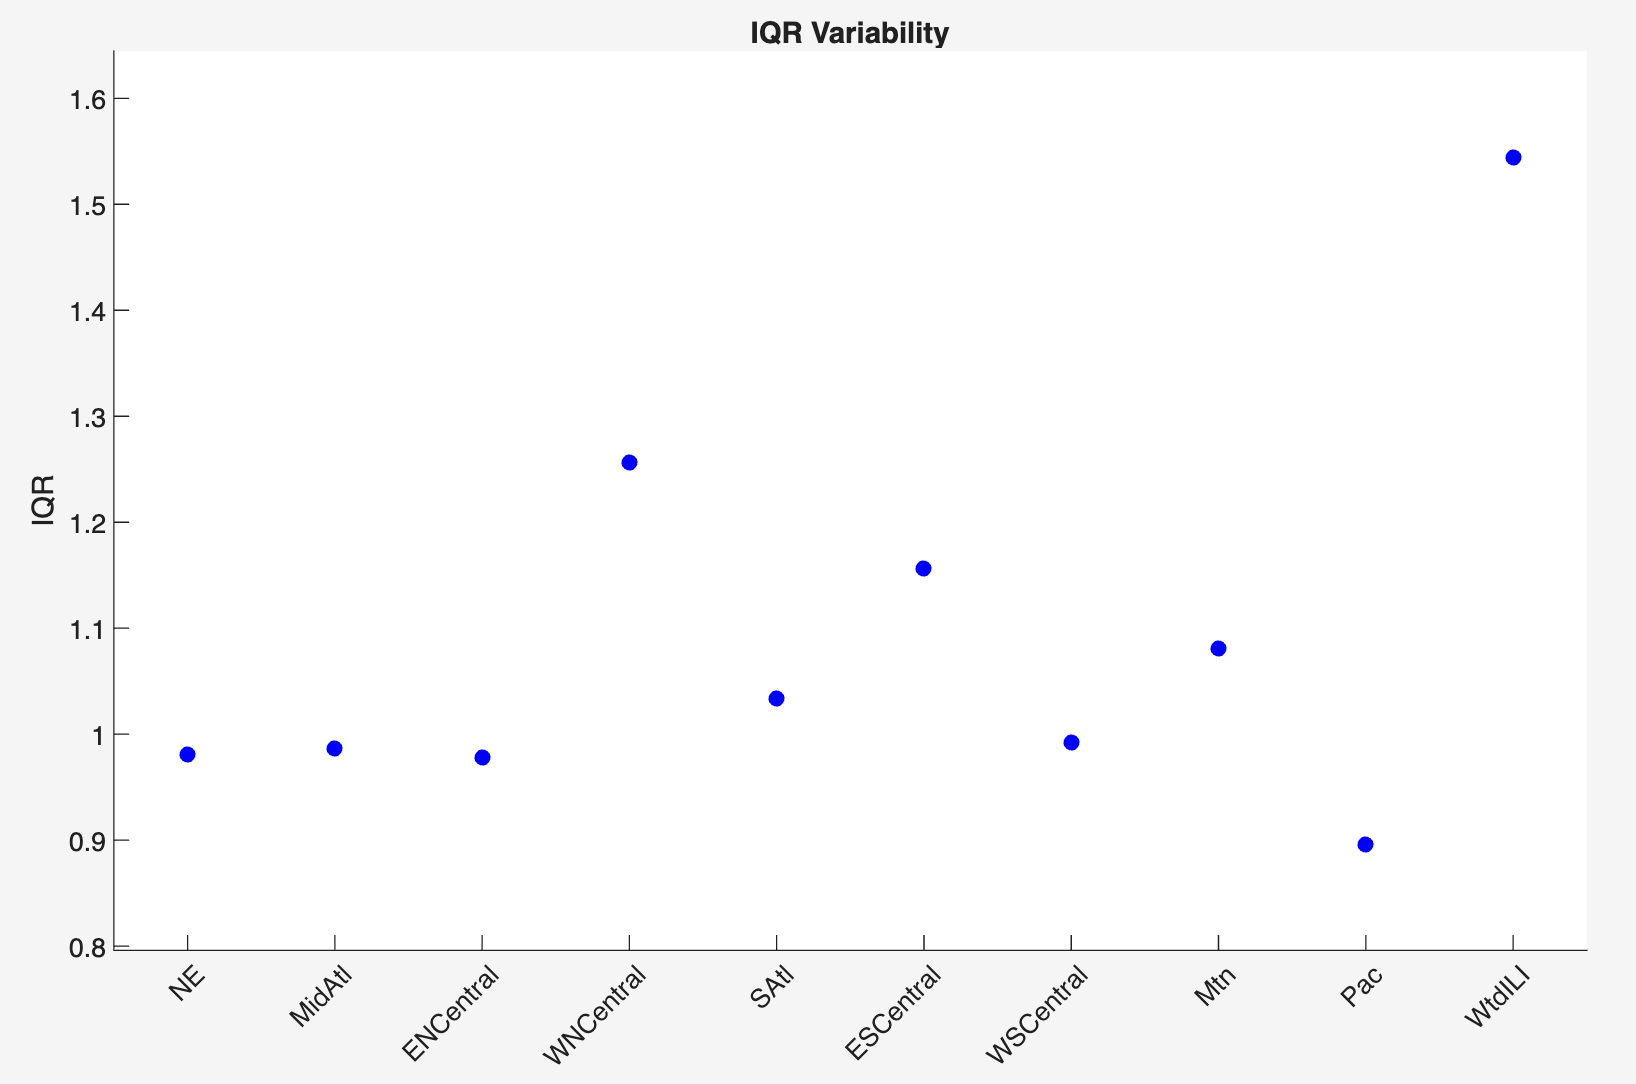
Users can select the variability metric from the dropdown, then generate a visualization comparing dispersion across features.
The variability module measures the spread of values within selected features using the IQR (Q3-Q1).
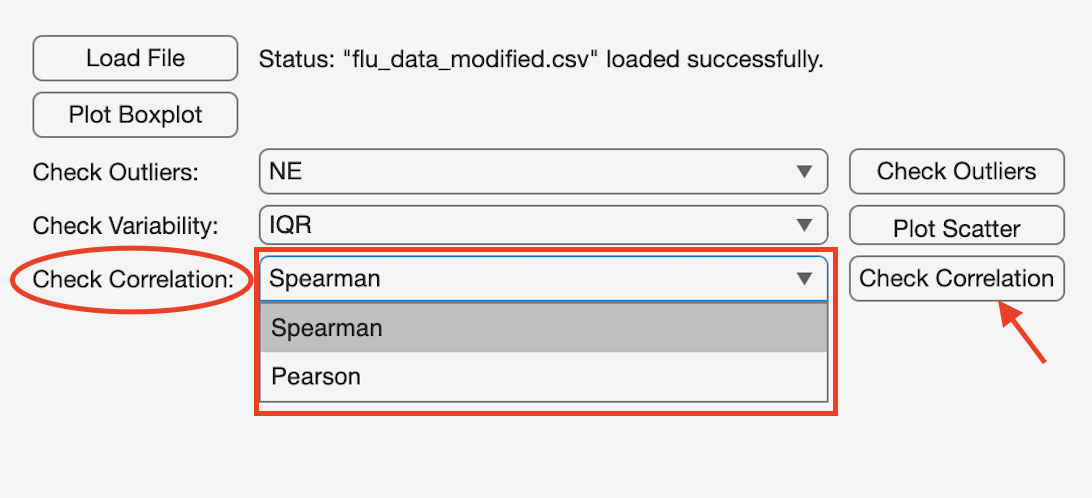
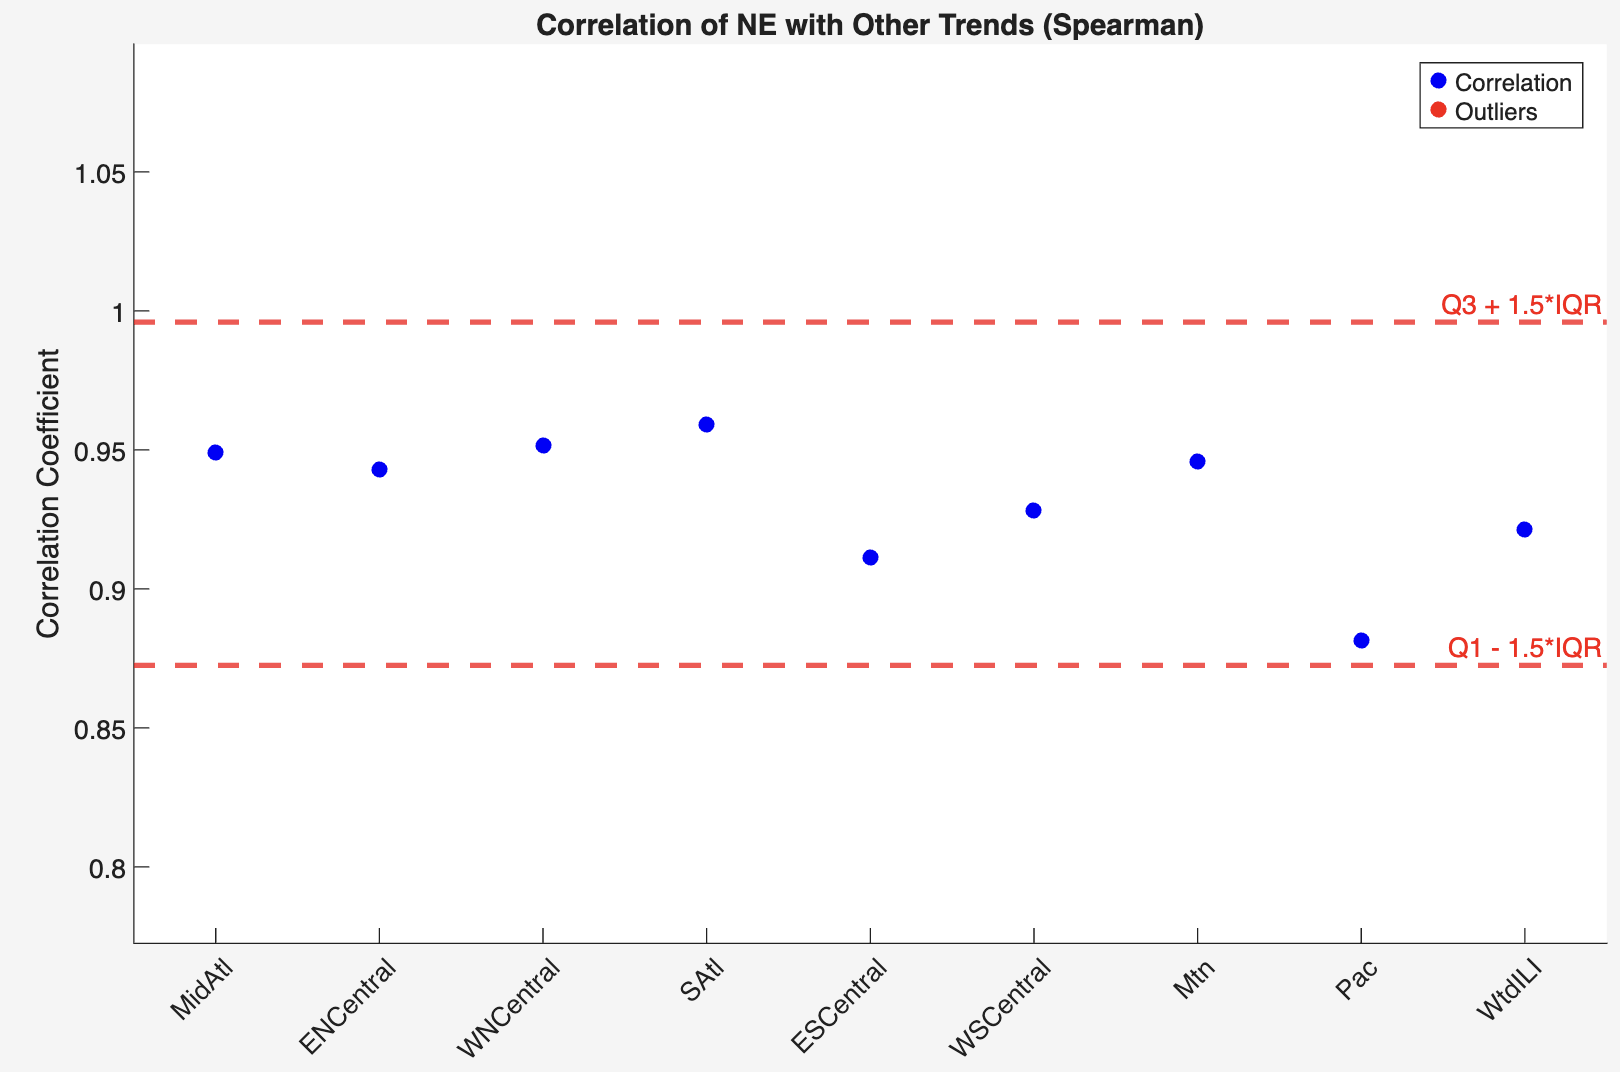
Correlation analysis
Select the correlation method from the dropdown (Spearman or Pearson), then generate pairwise similarity statistics.
The correlation module measures the strength and direction of association between selected features in the dataset.