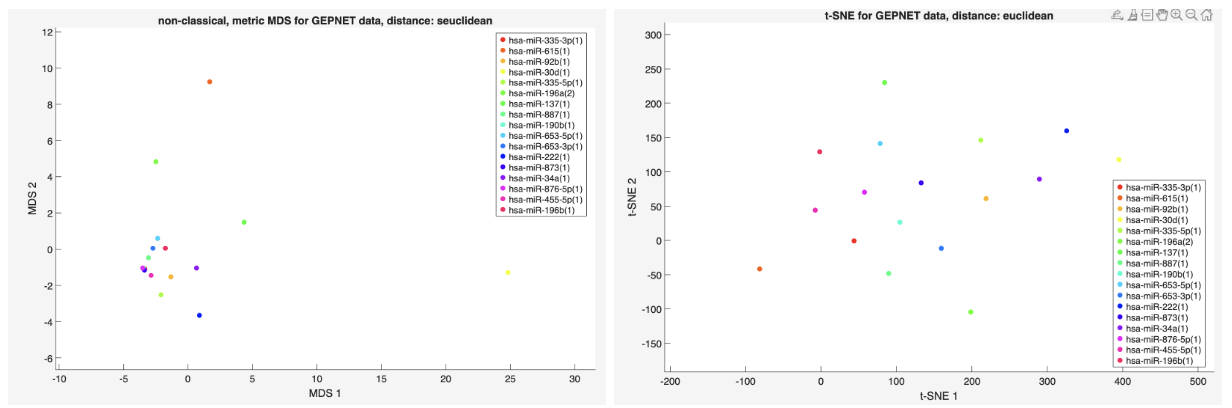
Explore high-dimensional datasets by projecting them into 2D visual space. By reducing dimensionality, it becomes easier to identify patterns such as clustering, separation between groups, and potential outliers.
Access the .m files through https://github.com/Renwick-Tyryshkin-Lab
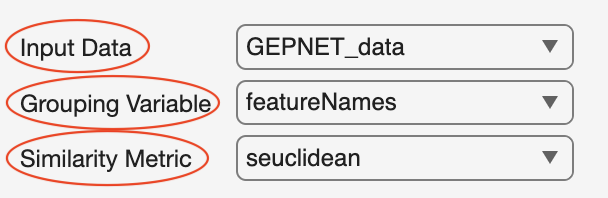
Select input and relevant parameters
use 'load <datasetname>' if file doesn't automatically show up in dropdown lost
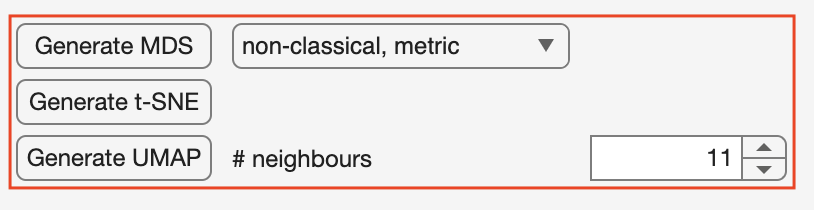
Select methods
MDS (multidimensional scaling): 2D layout that best preserves the pairwise distances between points in the original high-dimensional space. Useful for overall similarity patterns.
t-SNE: nonlinear method designed to preserve local neighborhoods. Useful for recognize clusters.
UMAP: nonlinear method that preserves local structure and maintains more of the global structure.
note: UMAP will not run in the 2025 version of Matlab! (please use older version)