Mining for data in the City of Kingston
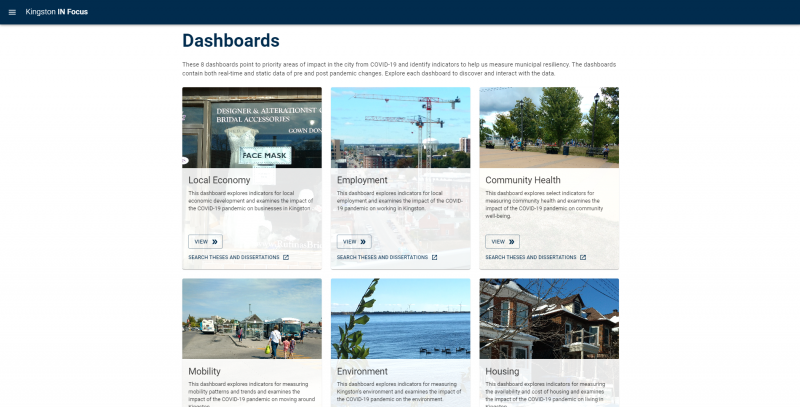
Faculty of Arts and Science researchers Carolyn DeLoyde and Betsy Donald have created a dashboard website that contains a wealth of information about the Kingston community from the perspectives of economic and social change, health, mobility, environment, and other sectors of the community.
Information contained on the dashboard updates in real time.
The project has been a collaborative effort with the City of Kingston, Kingston Economic Development, the Centre for Advanced Computing (CAC) and Office of Indigenous Initiatives at Queen’s University, Kingston and Area Association of Museums, Art galleries and Historic Sites (KAM), and the Department of Geography and Planning.
“Betsy Donald is Co-Principal Investor of the Digital Mobilities Lab with the University of Toronto– this is one of her main Social Sciences and Humanities Research Council (SSHRC) funded research projects,” explains Dr. DeLoyde, who works as a postdoctoral fellow with Dr. Donald and is the project manager for the Kingston Dashboard Project 1.0.
“She was awarded a grant to investigate digital mobility platforms in cities across Canada and then COVID hit. She pivoted the research to look at how cities were faring under COVID. Based on the success of a Toronto dashboard project, Dr. Donald decided to work with the City of Kingston on a similar dashboard that updates in real time. For that, Dr. Donald reached out to the Centre for Advanced Computing for technical support from software engineering internship students to create the dashboard visualizations. These positions were MITACs funded.
“Experiential learning is a big part of this project,” Dr. DeLoyde adds. “The interns we hired came to the meetings to meet the partners and understand first-hand what they wanted included on the dashboard. All partners also helped provide a stipend for these students.”
“The City of Kingston is grateful for the collaboration with Queen’s researchers, students, and other project partners in advancing access to data and insights on our community,” says Craig Desjardins, Director, Strategy, Innovation, and Partnerships, City of Kingston. “Evidence-based decision making is the hallmark of a leading city. The launch of the community data dashboard will be critical knowledge resource as our economy emerges from the pandemic and as we use the data insights to inform greater resilience for our collective future.”
The group decided collaboratively what metrics they wanted included that would be most useful to the users of the dashboard including local economy, employment, mobility, environment, housing, culture, demographics and community health. The information comes from a variety of places including Stats Canada, City of Kingston Data, and KFL&A Public Health. Searchable dissertations and theses from graduate level students at Queen’s that used Kingston as a study area are also included as reference points and additional data.
“This project has been exciting for KAM on many different levels,” says Jamie McKenzie-Naish, Managing Director, KAM. “As a lean, non-profit we do not have the resources to produce a data analytics project at this level of complexity and quality on our own – but working in collaboration with Queen’s University, the Centre for Advance Computing, Kingston Economic Development and City of Kingston, sharing resources and expertise, has been transformative. Not only did KAM have the opportunity to shape an innovative community data resource, but because of our involvement, we transformed our own internal data collection and management protocols, making better use of available digital technologies and improving ease of access.”
A research survey is embedded in the dashboard to find out how people are using the dashboard and how it can be improved and enhanced.
“Researchers, community groups, business owners, this dashboard is for the community, it’s a community tool,” Dr. DeLoyde says. “It’s a public facing dashboard. Other communities are going to see this as a model because of the partnerships we built.”
Looking forward to the future, Dr. DeLoyde says Dr. Donald is hoping to create Kingston Dashboard Project 2.0 that will feature more partners and even more public-facing data. There are also plans to hire an Indigenous person through the MITACS Indigenous Pathways program to bring more perspectives to the dashboard.
The public will have an opportunity to view the first iteration of the dashboard at kingstoninfocus.ca after October 4.